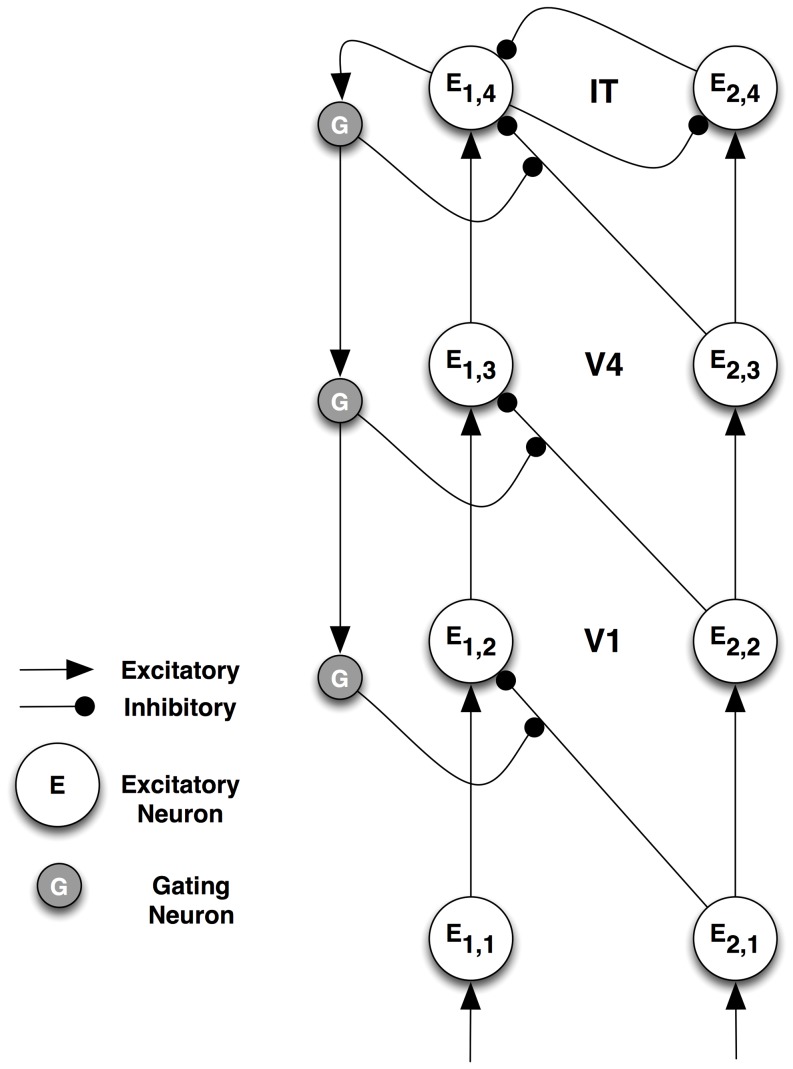
Figure 7. Full network for detailed timing analysis.
To investigate the timing of the effects in a ST hierarchy, the circuit described in Figure 3 was replicated to form four layers, with the output of one processing layer driving the input of the next. To illustrate the top-down nature of the ST process, gating control units are shown on the left side of the hierarchy. The circuit is symmetrical, and gating control units exist for each connection, but are omitted for clarity (same for the inhibitory interneurons). The top-level θ-WTA process (indicated by the mutually inhibitory connections at the top level of the network) determines a winner, and the corresponding gating signals are propagated down the network, triggering local θ-WTA processes within each winning neuron's afferents.

