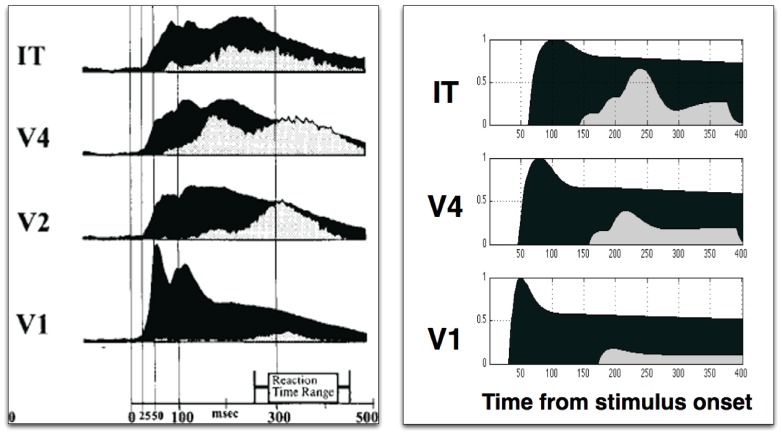
Figure 8. Attentional modulation of responses.
Black indicates the neural response to the stimulus, while the attentional modulation is represented in grey. (a) Temporal pattern of activations and attentional modulation in single-unit recordings in primates performing attentional tasks. Adapted from Fig. 9b in [12]. The neural activation (in black) shows the responses being generated progressively later in more superior areas, while the attentional modulation (grey) appears earlier in superior areas and later in early areas. (b) Model results showing a similar activation and modulation temporal pattern.

