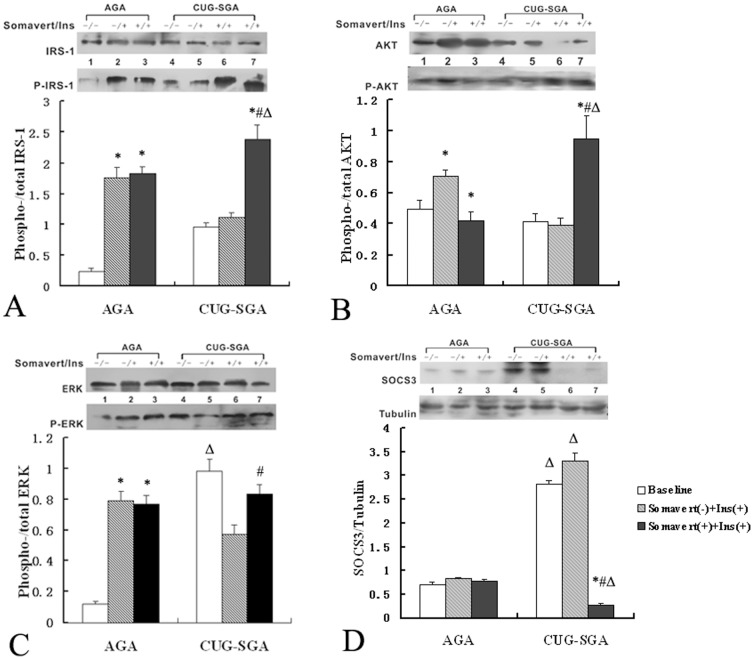
Figure 2. Immunoblot analysis of p-IRS-1, p-AKT, p-ERK and SOCS3 in skeletal muscle cell lysates from CUG-SGA and AGA rats before and after GHR inhibition.
Rats in the appropriate for gestational age (AGA) and small for gestational age with catch-up growth (CUG-SGA) groups (n = 16 per group) were further separated into three sub-groups. At four weeks of age, sub-group one received intraperitoneal injection of saline (control), sub-group two received insulin (Ins) stimulation and sub-group three received the GHR inhibitor Somavert before insulin stimulation. The skeletal muscle was then excised for examination of IRS-1, AKT, ERK, SOCS3, and the phosphorylation of IRS-1, AKT, ERK (p-IRS-1/p-AKT/p-ERK) via Immunoblot analysis. Activation of IRS-1, AKT and ERK were expressed as the ratio of p-IRS-1/p-AKT/p-ERK to total IRS-1, AKT and ERK, respectively. The level of SOCS3 was expressed as the ratio of SOCS3 to tubulin. Data were quantified from 16 samples and presented as the mean ± SD. *P<0.05 Somavert(-)+Ins(+) or Somavert(+)+Ins(+) vs baseline; # P<0.05 Somavert(-)+Ins(+) vs Somavert(+) +Ins(+); ΔP<0.05 CUG-SGA vs AGA.

