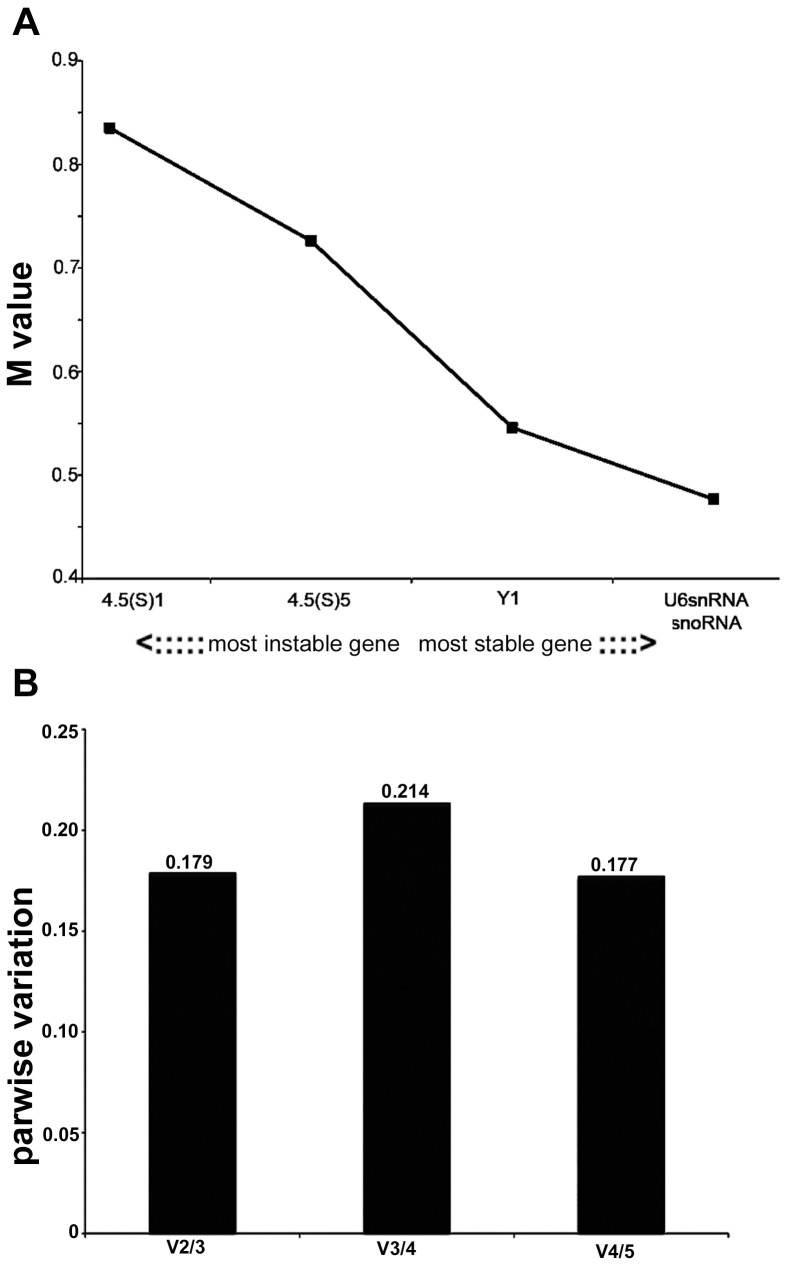
Figure 2. Selection of the most suitable reference genes for microRNA qRT-PCR analysis in the systemic PILO-model samples using geNorm analysis.
A) Expression stability measurements (M) for the five reference genes analyzed. The x-axis from left to right indicates the ranking of the genes according to their expression stability; lower M values indicate higher expression stability. B) Determination of the optimal number of reference genes for normalization was conducted. The software calculates the normalization factor from at least two genes at which the variable V defines the pair-wise variation between two sequential normalization factors.

