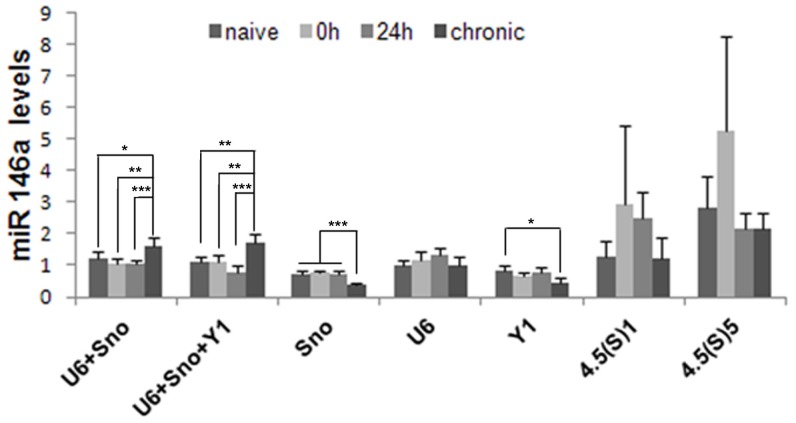
Figure 4. Relative quantities of miR-146a in the hippocampus of the systemic PILO- injected rats upon different normalization approaches.
qRT-PCR data were normalized by single reference gene and best combination derived by geNorm or NormFinder analysis (mean  SD, n = 6). The diagram shows mean levels of miR-146a transcripts in naive animals, epileptogenesis (0 h and 24 h) and chronic period. ANOVA, *
  , **
, **  , ***
, ***  .
.

