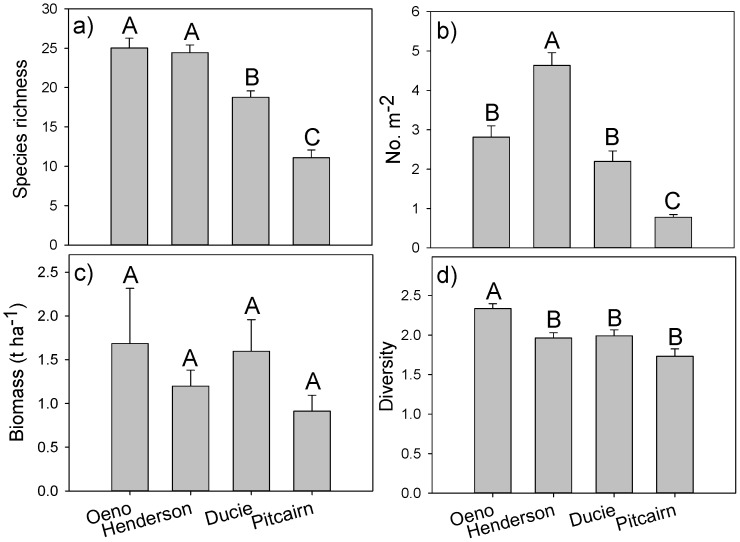
Figure 3. Comparison of fish assemblage characteristics among islands.
A) species richness, B) numerical abundance (no. indiv. m−2), C) biomass (t ha−1), D) diversity. One-way ANOVA results for each assemblage metric are in Results. Islands with the same letter are not significantly different at α = 0.05 (Tukey's HSD tests).

