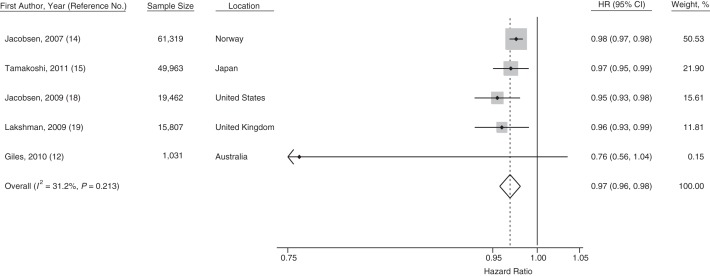
Figure 2.
Forest plot displaying a random-effects meta-analysis of the adjusted hazard ratios (HRs) for death from all causes associated with a 1-category (usually corresponding to a 1-year) increase in menarcheal age. Boxes represent the hazard ratios for each individual study with the size of the box reflecting the weight assigned to the study. Dotted vertical line represents the combined estimate. The width of the diamond illustrates the 95% confidence intervals (CIs) around the combined estimate.

