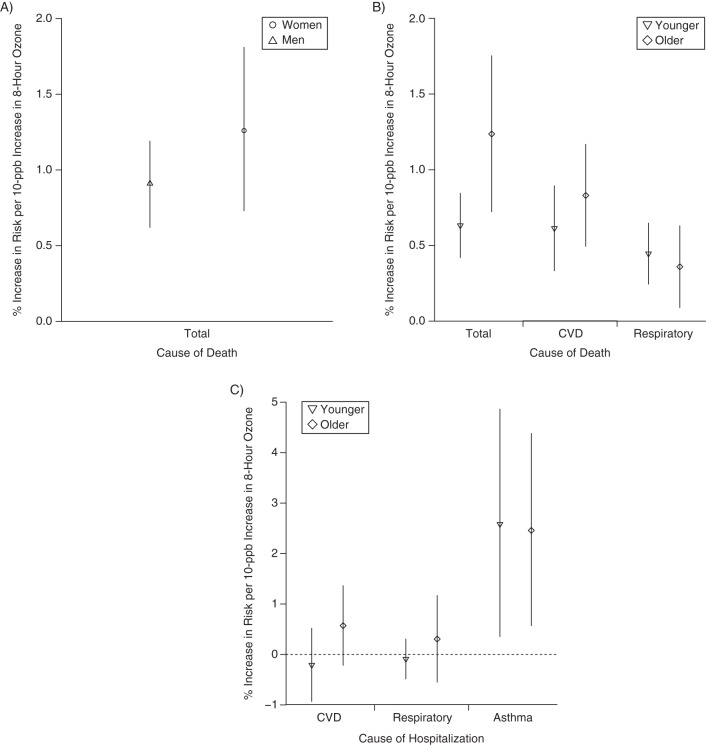
Figure 3.
Results from a meta-analysis of associations of ozone exposure with mortality and hospital admission, by sex or age, 1988–2013. A) Risk of mortality by sex; B) risk of mortality by age; C) risk of hospital admission by age. Points represent central estimates for the increase in health risk for a 10-ppb increase in daily 8-hour ozone concentration. Vertical lines represent 95% confidence intervals. CVD, cardiovascular disease.

