
Figure 5.
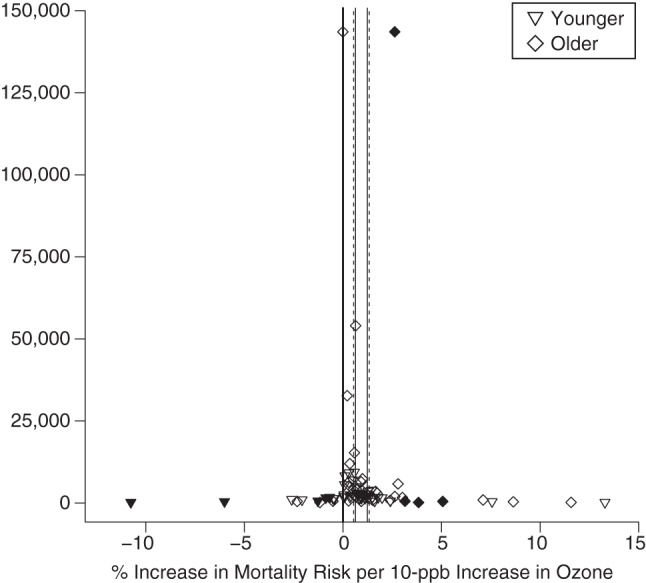
Estimates of the association between ozone exposure and total mortality for published studies included in a meta-analysis, by age, 1988–2013. Estimates show the percentage increase in risk per 10-ppb increase in 8-hour ozone concentration. The open points represent individual study estimates; the closed points represent “missing studies” for which data were derived from the trim-and-fill method to adjust for publication bias. Solid vertical lines represent overall estimates based on study results; dashed lines represent overall estimates adjusted for publication bias.