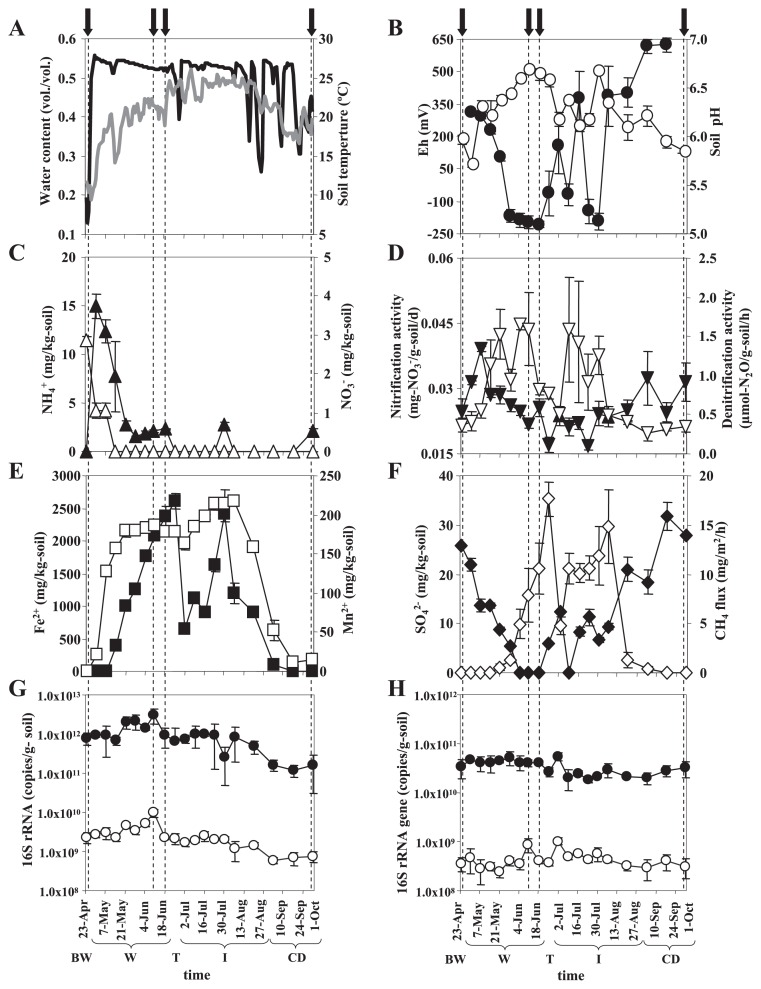
Fig. 1.
Seasonal transition of soil biogeochemical properties in paddy soils for the sampling period. (A) Daily average soil water content (black line) and soil temperature (gray line) at 5-cm depth in the experimental paddy field; (B) soil redox potential (Eh) (closed circles) and pH (open circles) at 5-cm depth; (C) concentrations of NH4+ (closed triangles) and NO3− (open triangles); (D) nitrification activity (closed reverse triangles) and denitrification activity (open reverse triangles); (E) concentrations of Fe2+ (closed squares) and Mn2+ (open squares); (F) concentrations of SO42− (closed diamonds) and CH4 flux from the experimental field (open diamonds); (G) amount of bacterial (smaller closed circles) and archaeal (smaller open circles) 16S rRNAs measured by RNA-based qPCR; and (H) copy number of bacterial (smaller closed circles) and archaeal (smaller open circles) 16S rRNA genes measured by DNA-based qPCR. Mean ±SD is shown (n=3). Samples as indicated with arrows and dotted lines were used for clone library analysis. Letters shown at the bottom indicate the water management stages: before waterlogging (stage BW; until 29 April), waterlogging (stage W; April 30–June 18), temporal drainage (stage T; June 19–30), intermittent drainage with cycles of artificial drainage and irrigation (stage I; July 1–August 31), and after complete drainage (stage CD; after September 1) (see Fig. S1).

