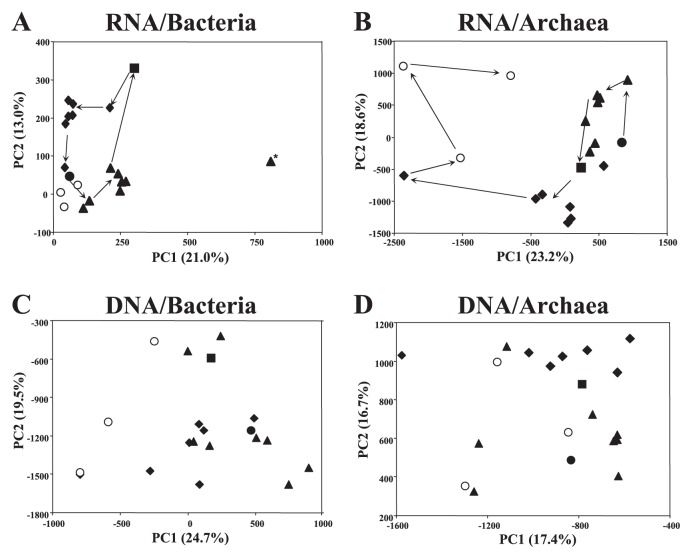
Fig. 2.
Transition of bacterial and archaeal community structures as assessed by principal component analysis (PCA) based on the denaturing gradient gel electrophoresis (DGGE) profiles. PCA plots based on (A) RNA-based DGGE targeting bacterial 16S rRNA; (B) RNA-based DGGE targeting archaeal 16S rRNA; (C) DNA-based DGGE targeting bacterial 16S rRNA genes; and (D) DNA-based DGGE targeting archaeal 16S rRNA genes are shown. Legend: closed circle, stage BW; closed triangles, stage W; closed square, stage T; closed diamonds, stage I; open circles, stage CD. Arrows indicate the temporal transition sequences. Values in parentheses show the percentage of community variation explained by each component. The symbol with asterisk in panel A indicates the profiles derived from the sample collected on May 21 (see Supplementary information).

