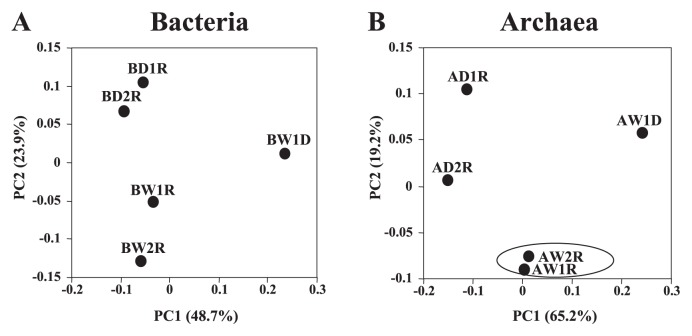
Fig. 3.
Principal coordinate analysis (PCoA) plots based on (A) bacterial and (B) archaeal clone libraries. PCoA plots were generated using Fast UniFrac analysis based on the weighted algorithm with normalization. Values in parentheses show the percentage of community variation explained by each coordinate. Samples in circles have significant similarity (P>0.05). The first letter of library ID (A or B) represents the target community: B, bacteria; A, archaea. The final letter of library ID (D or R) represents the nucleic acid used for analysis: D, DNA; R, RNA. Libraries with ID containing “D1,” “W1,” “W2,” and “D2” were derived from soil samples collected on Apr. 23, June 10, June 18, and October 1, respectively. So, D1 and D2 libraries were derived from drained conditions, while W1 and W2 libraries were derived from waterlogged conditions.

