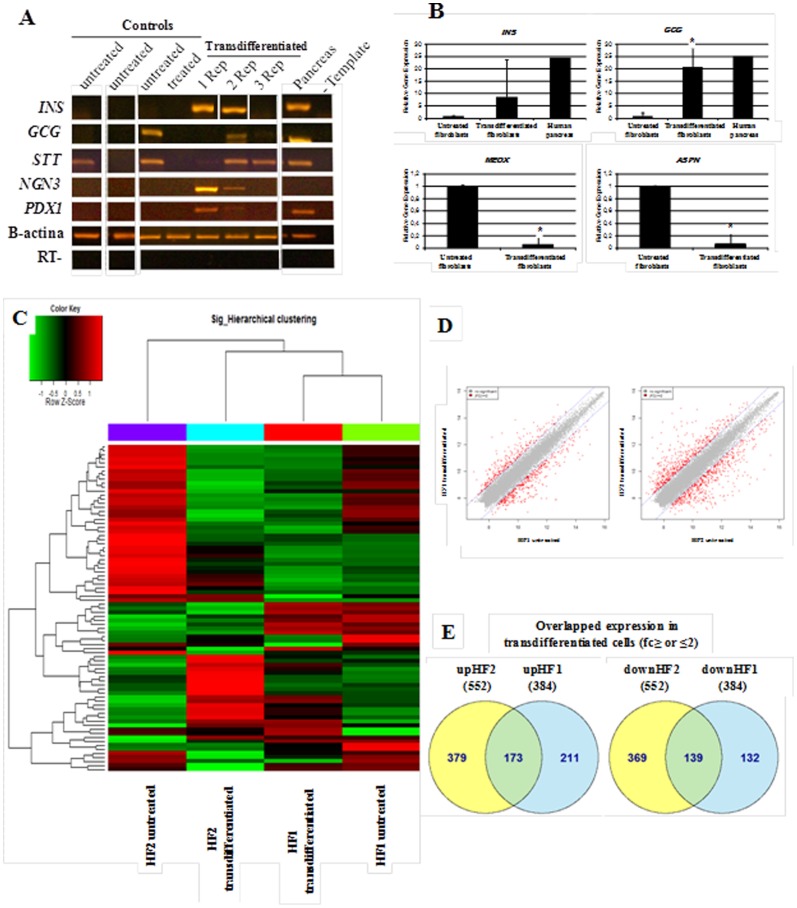
Figure 2. Gene expression analyses of fibroblasts before and after chemical transdifferentiation.
(A) Gene-expression profiles of transdifferentiated in vitro fibroblasts from patient whit diabetes type 1 (patient HF1, tree replicates) and parental controls fibroblasts by RT-PCR analysis. (B) Gene-expression profiles of transdifferentiated fibroblasts (n = 6 replicates) and untreated control fibroblasts (n = 3 replicates) by quantitative PCR analysis in pancreatic genes (INS, GCG) and fibroblast markers (MEOX, ASPN) (t test, P<0.05). The bars represent the standard errors of independent experiments. (C) Hierarchical clustering of differentially expressed genes. Using normalized value, plotted a heat map of hierarchical clustering on distance similarity for samples and probes. (D) Plotted a scatter plot of expression level between groups. The red dots indicate significant probes (2-Fold). (E) Venn diagram for overlapped upregulated (up) and downregulated (down) gene expression in transdifferentiated cells groups. HF1 and HF2: fibroblasts from patients with type 1 diabetes; Transdifferentiated: fibroblasts chemically transdifferentiated for 30 days; Untreated: fibroblasts day 2–5; Control treated: fibroblasts cultured for 30 days without chemical induction. Rep: Replicates.

