Fig. 3.
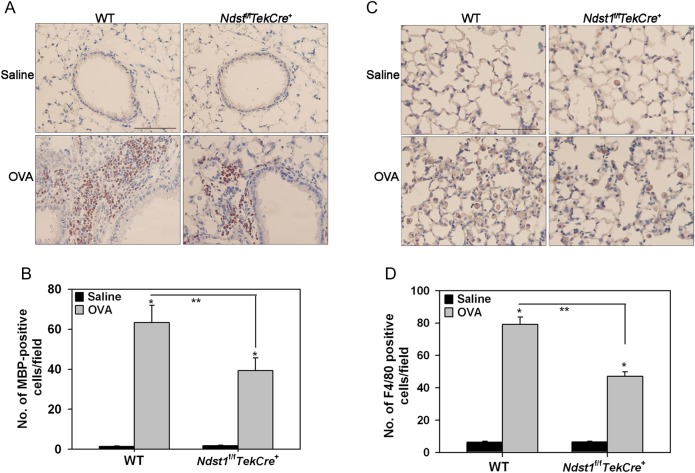
Reduced tissue eosinophils and macrophages in allergen-exposed Ndst1f/fTekCre+ mice. Lung tissue from control and allergen-exposed WT and Ndst1f/fTekCre+ mice was evaluated for eosinophils and macrophages by immunohistochemical staining. (A) Eosinophils were identified with eosinophil-specific MBP using rat mAb against murine MBP. A representative image of lung sections from each group is shown. (B) MBP-positive cells in randomly selected non-overlapping microscopic fields of lung tissue (5 fields/mouse for control group and 17 ± 2 [Mean ± STD] fields/mouse for allergen-exposed groups) were counted at a magnification of ×400. (C) Lung tissue macrophages were identified with rat anti-mouse F4/80. A representative image of lung sections from each group is shown. (D) The number of F4/80-positive cells in randomly selected non-overlapping microscopic fields (10 fields/mouse) of the alveolar tissue was counted at a magnification of ×400. Scale bar in A and C represents 100 μm. Combined data (Mean ± SEM) of n = 5–6 mice/group is shown in B and D. *P < 0.01 in for comparison of control vs. allergen-exposed mice and **P < 0.02 for comparison of allergen-challenged groups.

