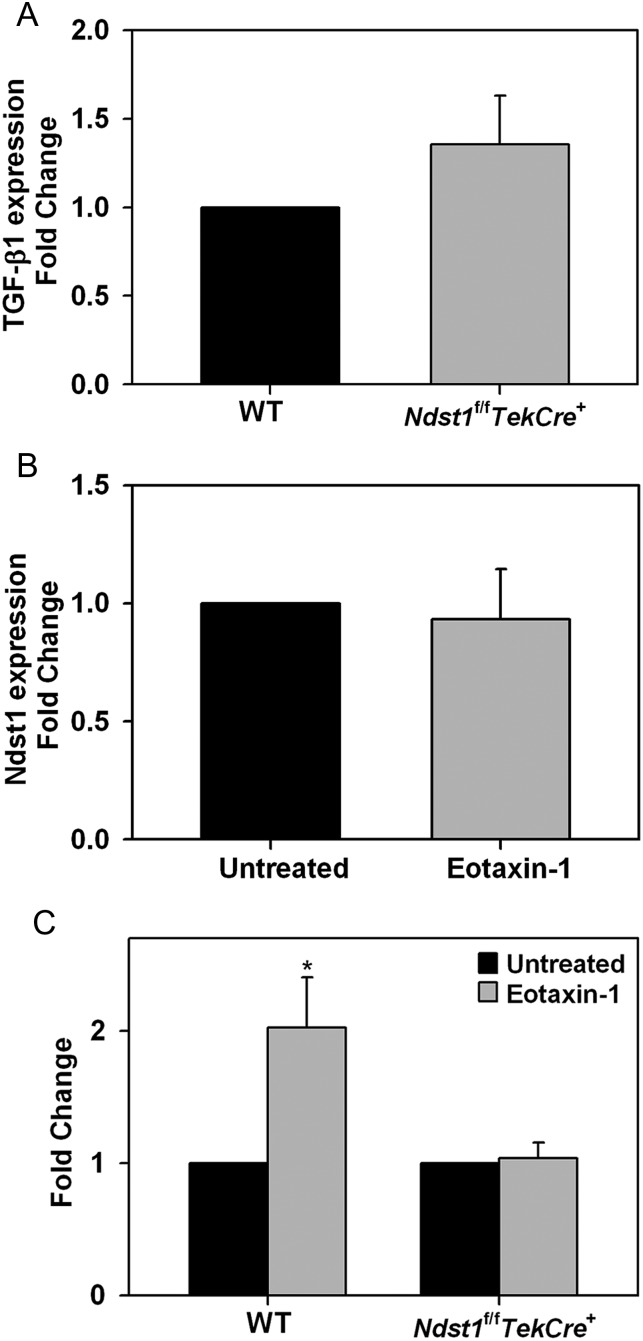
Fig. 7.
Expression of TGF-β1 by eosinophils from WT and Ndst1f/fTekCre+ mice. (A) Expression of TGF-β1 in unstimulated eosinophils cultured from BM of WT and Ndst1f/fTekCre+ mice by qPCR. (B) Expression of Ndst1 mRNA by eosinophils from WT mice with and without activation (100 nM eotaxin-1 for ∼16 h). (C) Expression of TGF-1 mRNA by eosinophils from WT and Ndst1f/fTekCre+ mice with and without activation with eotaxin-1. Combined data of three independent experiments with eosinophils from 2 different mice/experiment is shown (n = 6 mice/group). Results are expressed as fold change in expression relative to expression in WT cells in A and untreated cells in B and C that is set as 1. Data represent mean ± SEM. *P < 0.025 in C for comparison of untreated vs. eotaxin-1-treated eosinophils.

