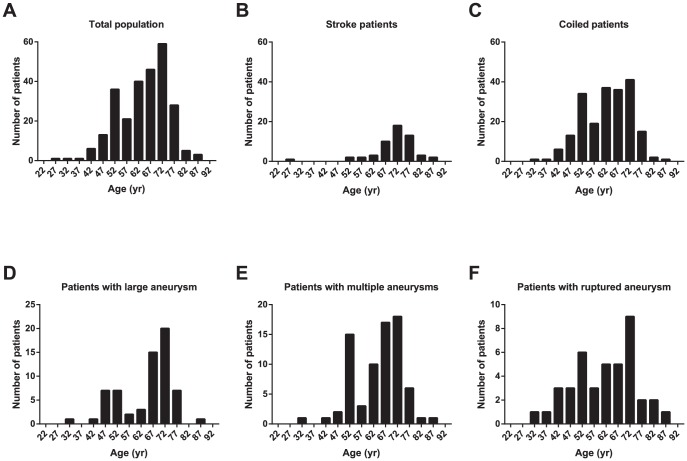
Figure 1. Age distribution of the study population.
(a) Age distribution of the total population (n = 260) was bimodal; there were a large number of patients aged 50–54 years. (b) The stroke patients (n = 57) were relatively old, and the distribution was unimodal. (c) Age distribution of the coiled patients (n = 206) demonstrate another peak which contributed to the bimodality of the total population. Patients with (d) large IAs (≥7, n = 64), (e) multiple aneurysms (n = 75), and (f) a ruptured aneurysm (n = 41) also showed bimodal age distributions. The labels on the x-axis indicate mean ages of 5-year age groups starting at age 20.

