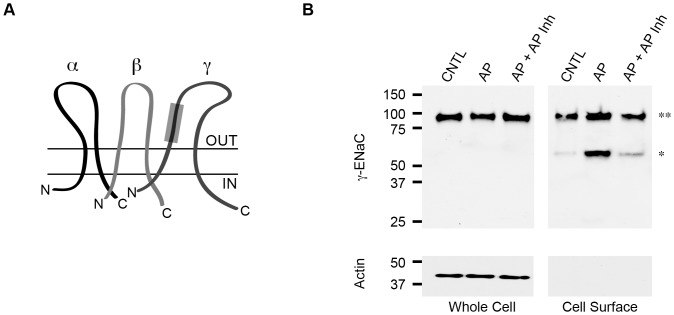
Figure 1. ENaC cleavage by active AP.
Cell surface cleavage of γ-ENaC was assessed biochemically using purified AP and AP Inh. A, a cartoon schematic of the ENaC channel is shown with the α-, β-, and γ-subunits labeled. The protease sensitive tract in γ-ENaC is shown as a gray box and spans residues 139 to 181 [49]. B, cell surface cleavage of ENaC was assessed by western blotting. Total ENaC is shown for control cells (CNTL), AP treated cells, or cell co-treated with AP and AP Inh from whole cell lysates, Whole Cell. The cell surface ENaC was assessed after biotinylation and streptavidin capture, Cell Surface. From the cell surface pool of ENaC the full length (**) and cleaved (*) forms of the channel are observed. Actin was used as a loading control and was not observed in biotinylated samples.

