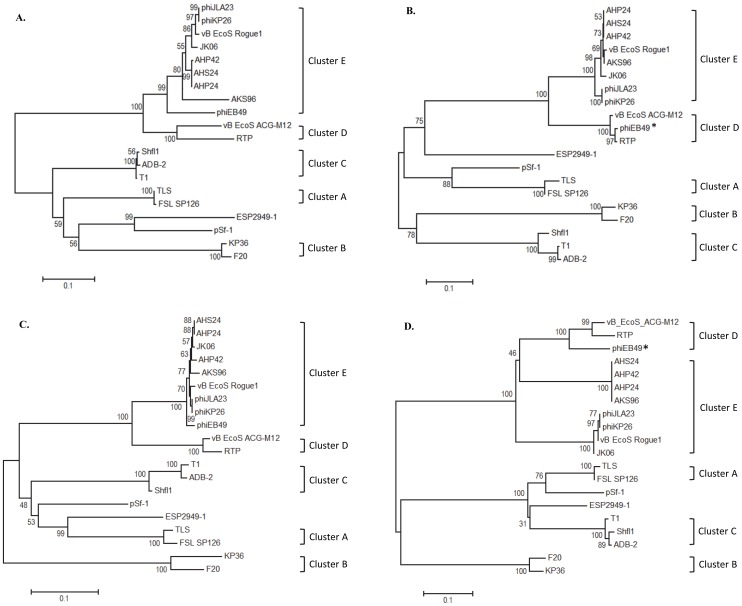
Figure 2. Evolutionary relationships of major proteins.
The evolutionary history was inferred using the Neighbor-Joining method [63]. The optimal tree with the sum of branch length for A, large subunit of terminase ( = 2.05), B, portal protein ( = 2.2), C, tail fiber ( = 1.61), D, major capsid ( = 2.05), is shown; The percentage of replicate trees in which the associated taxa clustered together in the bootstrap test (500 replicates) are shown next to the branches [64]. The tree is drawn to scale, with branch lengths in the same units as those of the evolutionary distances used to infer the phylogenetic tree. The evolutionary distances were computed using the JTT matrix-based method [65] and are in the units of the number of amino acid substitutions per site. The analysis involved 20 amino acid sequences. All positions containing gaps and missing data were eliminated. There were a total of 429 positions (A), 244 positions (B), 807 positions (C), 305 positions (D), in each final dataset. Evolutionary analyses were conducted in MEGA5 [66]. Scale bar represents 0.1 substitutions. The asterisk represents phages of which evolutionary relationships of major proteins differed from those of whole genome.

