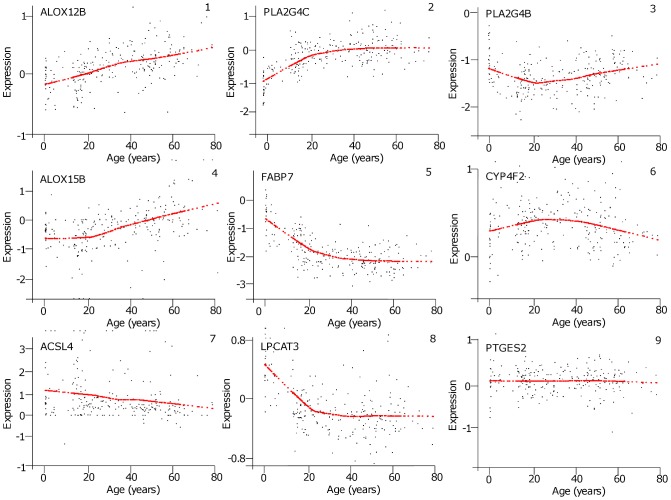
Figure 1. Representative expression patterns.
Graphs were exported directly from BrainCloud. Representative graphs for patterns 1–9 shown here are identified by an example gene. Expression patterns of all genes included in the study are shown in Table 1. The first expression pattern increases at a relatively equal rate throughout life, while the seventh pattern decreases at a relatively equal rate throughout both intervals. Pattern 2 increases sharply during Development then the increase slows during Aging; pattern 5 is the opposite with a sharp decrease during development and a gradual decrease during aging. Pattern 3 decreases during Development, then increases during Aging and pattern 6 increases during Development then decreases during Aging. Pattern 4 remains steady during Development then increases during Aging. Pattern 8 decreases during Development then doesn't change during Aging. Pattern 9 shows minimal changes during both intervals. The units for the y-axes are log2(Sample/Ref). A two-fold change in gene expression occurs at one and negative one on the y-axis. The y-axes are not all identical.

