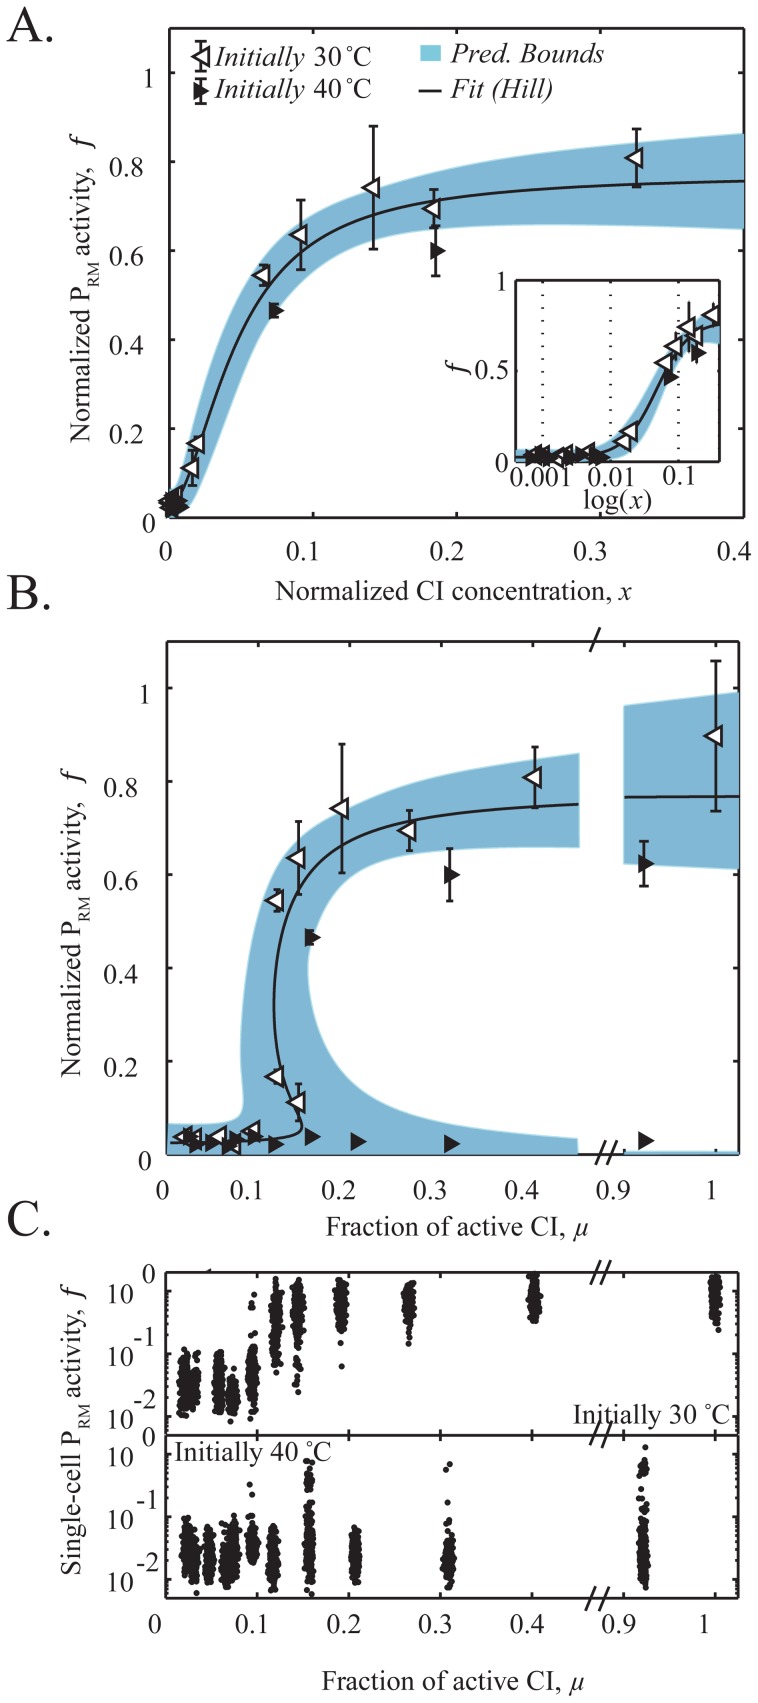
Figure 2. Experimental demonstration of bistability and hysteresis.
(A) PRM promoter activity as a function of CI concentration in the cell. Both observables were measured as described in the main text, and are normalized by the mean promoter activity of the initial lysogenic state (at 30°C). Black and white triangles represent data from cells initially grown in the lytic (40°C) and lysogenic (30°C) states, respectively. Each data point was obtained by averaging over three independent experiments. Error bars represent the standard error of these three experiments. The solid line is a fit to a Hill function and the shaded blue area is the 95% confidence interval of that fit. The inset depicts the same data in semi-logarithmic scale. (B) Predicted and measured steady-states of the lysis/lysogeny circuit. Prediction: Solid line, predicted PRM steady states based on the fitted PRM regulatory curve in panel A. Shaded region represents the confidence boundary of the theoretical prediction. Measurement: white and black triangles are the same data set depicted in panel A, plotted with respect to μ. (C) Hysteretic behavior of the lysis/lysogeny circuit. The PRM activity of individual cells is plotted, for cultures grown initially at low temperature (high PRM activity, top panel) and cultures grown initially at high temperature (low PRM activity, bottom panel). Each dot represents one cell (total 300 cells randomly chosen from our data at each temperature). For visualization purposes, individual data points were given a small random horizontal deviation, centered on the correct value of μ for that temperature.

