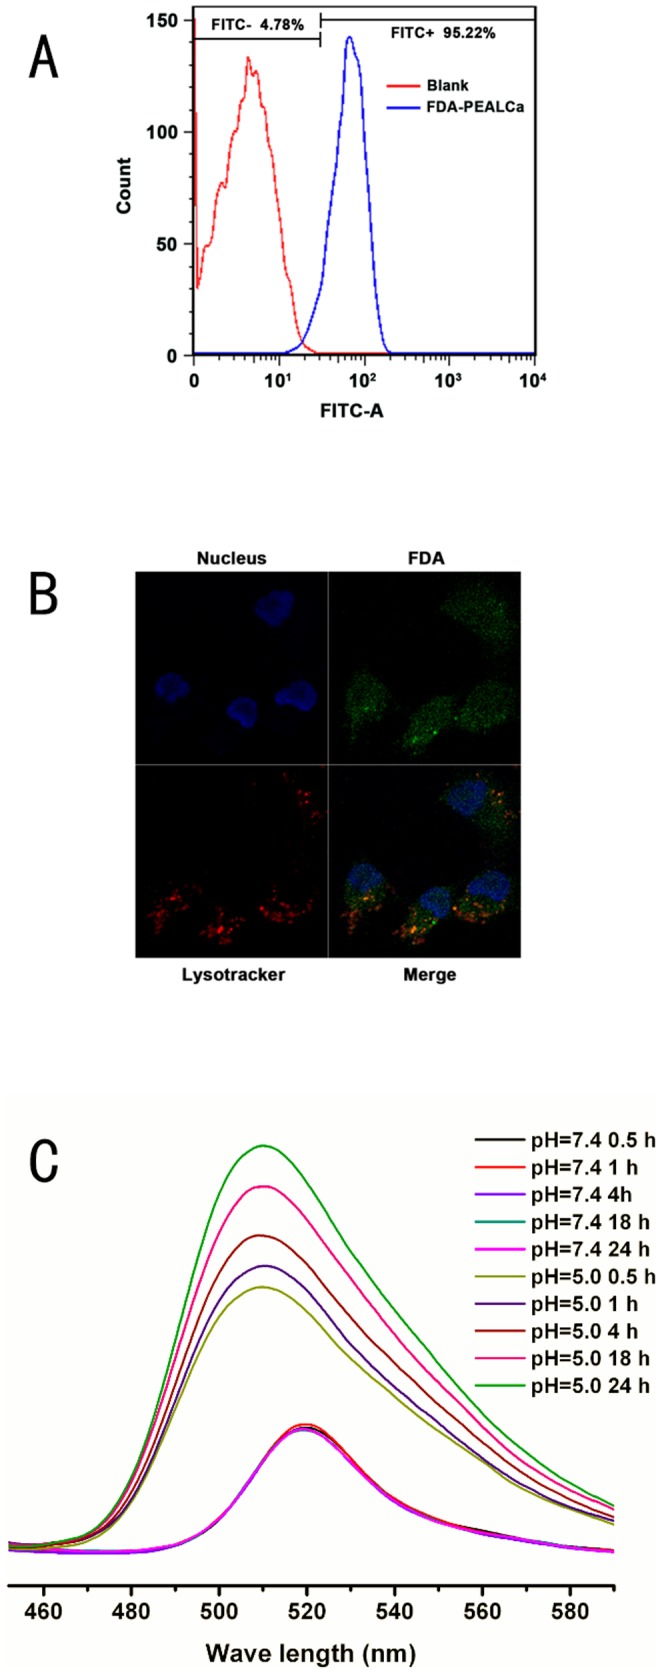
Figure 3. Intracellular drug delivery and release efficiency measurements.

Quantitative analysis of FDA-positive LoVo cells by flow cytometry after incubation with FDA-SPIO-PEALCa (A). Confocal laser scanning microscopy (CLSM) images (1000 ×) of LoVo cells after treated with FDA-SPIO-PEALCa (B). The lysosomes and nuclei were stained by red and blue fluorescent probe, respectively. In vitro FDA released from PEALCa micelle at 37 °C in HCl (pH 5.0) and PBS (pH 7.4) (C).
