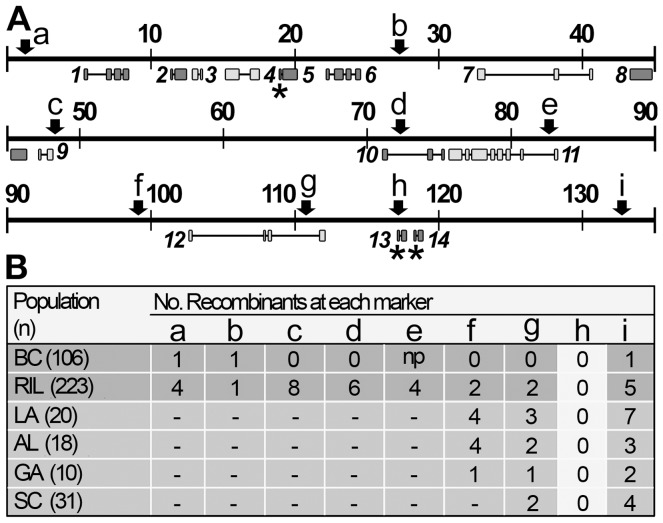
Figure 2. Mapping vH13 within BAC Hf5p7.
(A) Map showing the positions of the molecular markers (a-i) that were used to refine the position of vH13 on BAC Hf5p7 (scale = kb). Predicted genes are shown below the map. Genes transcribed from left-to-right are colored dark grey and genes transcribed from right-to-left are colored light grey. Asterisks indicate genes encoding predicted signal peptides. (B) Table showing the numbers of recombinant individuals within structured mapping populations (BC and RIL) and field populations (LA, AL, GA and SC) at each of the markers (a-i) shown in A.

