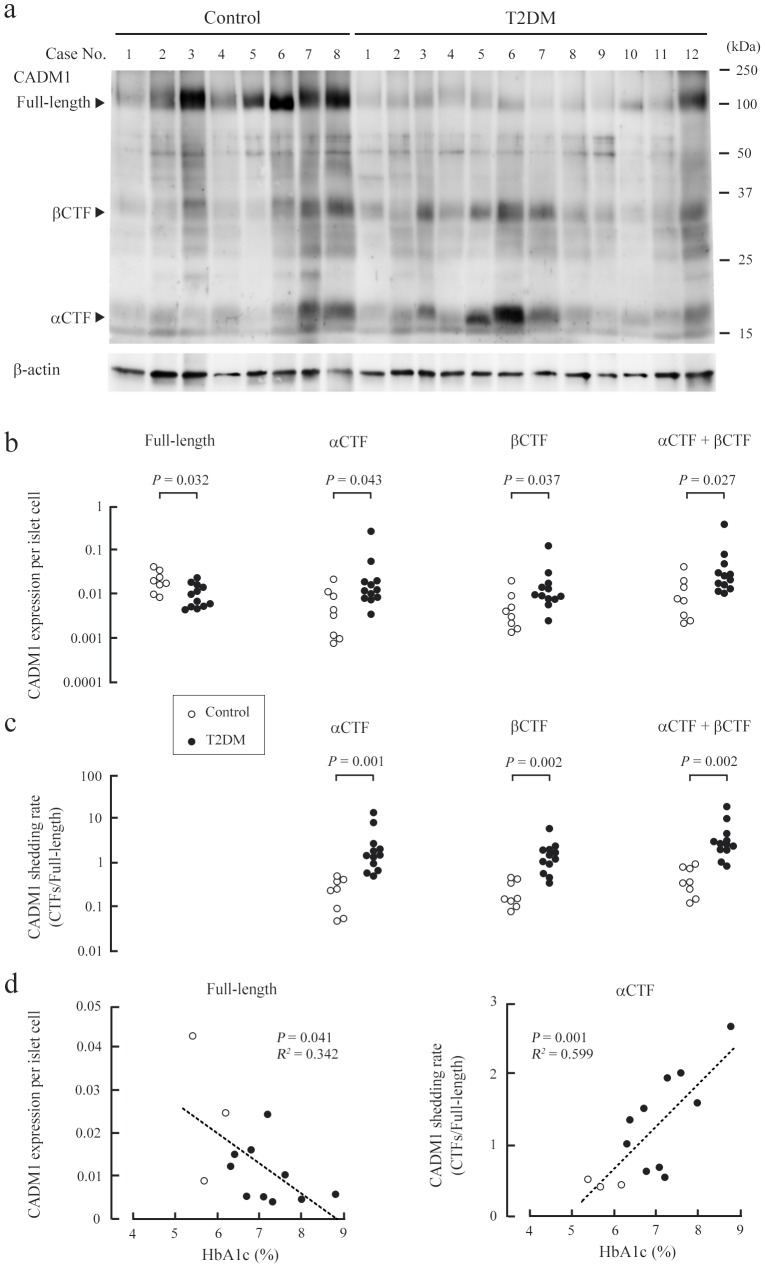
Figure 1. Increased ectodomain shedding of CADM1 in T2DM pancreata.
(a) Western blot analysis of CADM1 expression in control and T2DM pancreata. Cases are numbered as in Table S1. Arrowheads indicate bands corresponding to the full-length, αCTF, and βCTF forms of CADM1. The blot was reprobed with an anti-β-actin antibody to show protein loading. (b) CADM1 expression per islet cell in each patient sample. For each lane in a, the intensities of the full-length CADM1, αCTF, βCTF, and β-actin bands were quantified, and CADM1 levels were expressed relative to β-actin and the islet cell count (/cm2 of tissue). Statistical significance was analyzed with the Mann-Whitney U-test. P-values are shown. (c) CADM1 ectodomain shedding rates (relative amounts of CTFs to the full-length CADM1). Statistical significance was analyzed with the Mann-Whitney U-test. P-values are shown. (d) Correlation of HbA1c levels with full-length CADM1 expression per islet cell (left) or the CADM1 shedding rate (αCTF/full-length; right). In each graph, the dot distribution approximated a linear function (dotted lines). Correlations and statistical significance were analyzed with Spearman’s rank test. R2 and P-values are shown.

