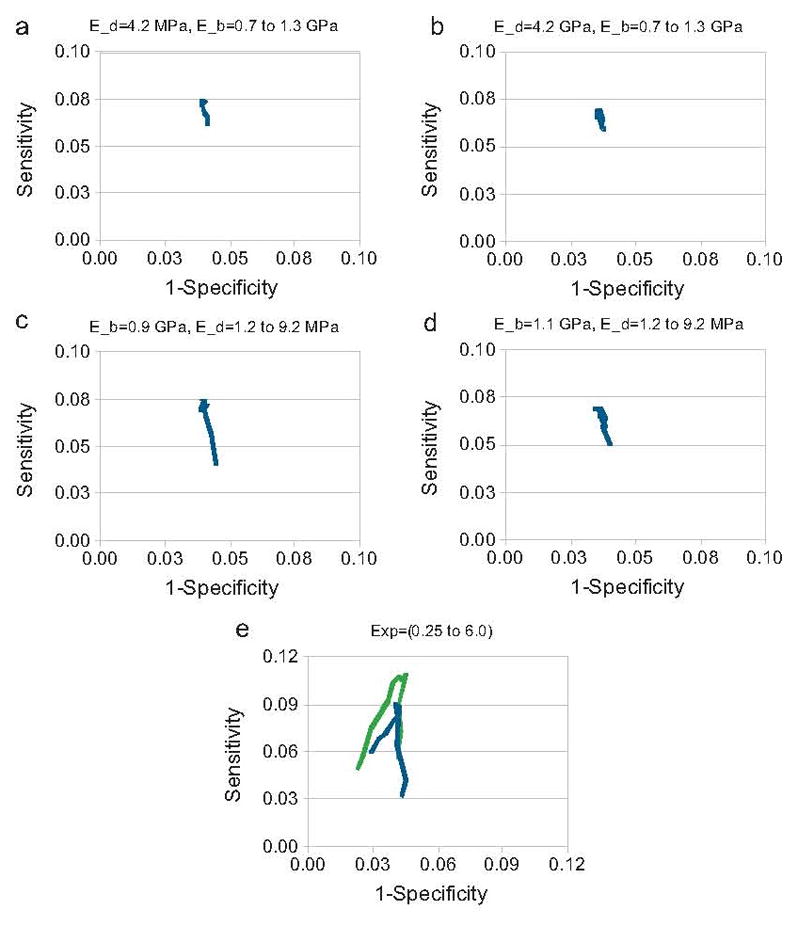
Fig. 2.

The modified ROC curves showing the testing of Young’s modulus for bone (E_b) and for the discs (E_d) in Eq. (1) are provided in figures (a)–(d). Results for females are given in figures (a) and (c) and the results for males are given in figures (b) and (d). The Young’s modulus for bone was varied from 0.7 to 1.3 GPa and Young’s modulus for the discs was varied from 1.2 to 9.2 MPa. Figure (e) shows how adding age into the model affects performance in green (For interpretation of the references to color in this figure legend, the reader is referred to the web version of the article.) compared to without age in blue.
