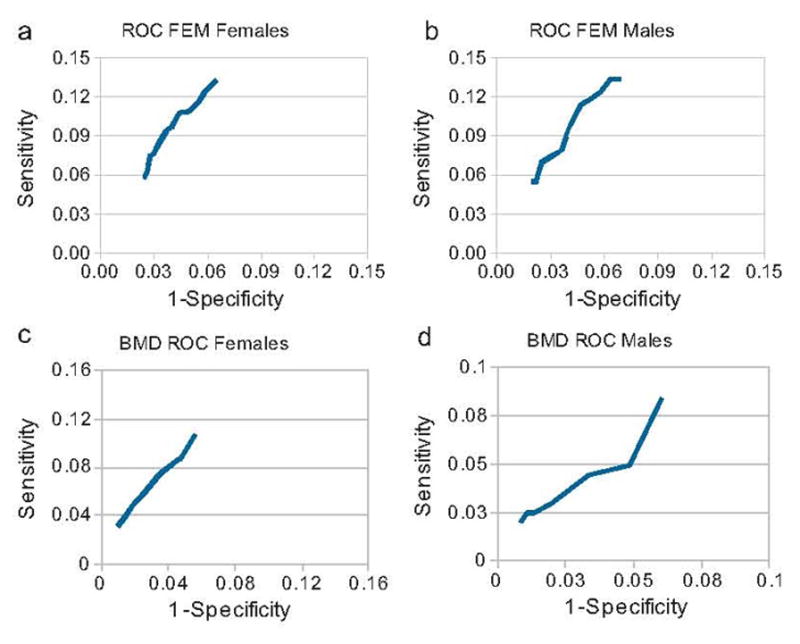
Fig. 4.

The ROC curves for the BMD results are provided in figures (a) and (b). The ROC curves for the FEM results using the optimal values for the exponent (Exp) and age normalization factors (Age_Norm) in Eq. (1) are provided in figures (c) and (d). Women are provided in figures (a) and (c) and men are provided in figures (b) and (d).
