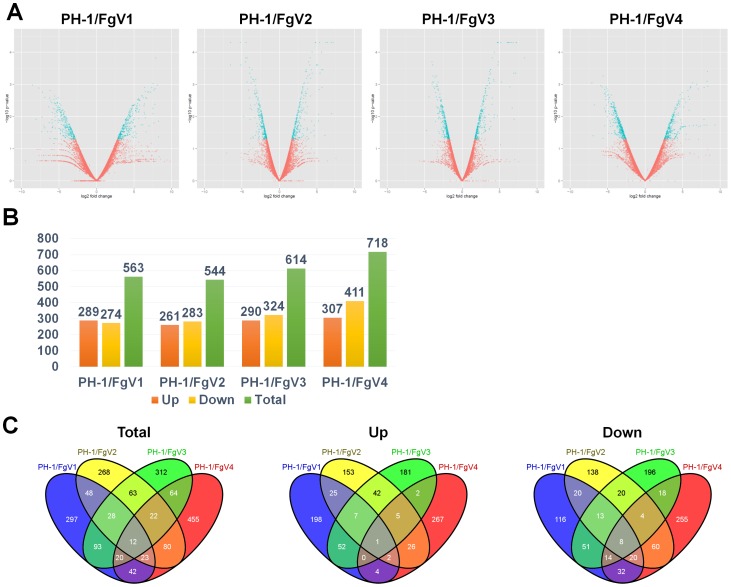
Figure 2. F. graminearum genes that were differentially expressed in response to four mycoviruses and that were identified by RNA-Seq.
(A) Volcano plot of RNA-Seq data using log2fold change and log10p-value. X and Y axes represent log2-converted fold change and log10-converted p-value. (B) The number of DEGs. Orange, yellow, and green colors indicate number of DEGs for up-regulated, down-regulated, and total of up- and down-regulated genes, respectively. (C) Venn diagrams illustrating the number of genes that were differentially expressed in subsets of the four virus-infected strains. Total, down, and up indicate total numbers of DEGs, the numbers of up-regulated DEGs, and the numbers of down-regulated DEGs, respectively.

