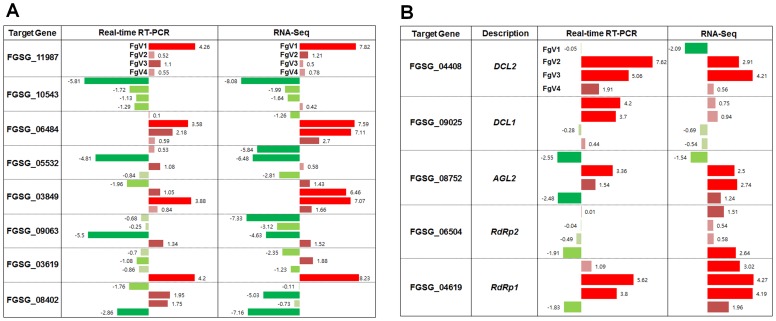
Figure 4. Validation of RNA-Seq data by real-time RT-PCR.
The expression of eight selected genes (A) and five genes involved in RNAi silencing (B) was examined by real-time RT-PCR. Up-regulation and down-regulation of selected genes were indicated by red and green bars with corresponding fold changes, respectively.

