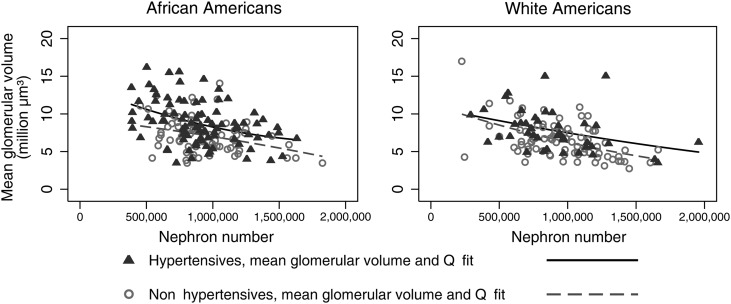
FIGURE 2:
Subjects 18–70 years old showing by quadratic prediction plots an inverse relationship between Vglom and Nglom for African Americans and whites in which the Vglom of hypertensive subjects are larger than that of non-hypertensive subjects throughout the range of Nglom. Multivariable robust regression (Vglom-dependent variable): African Americans, coefficient Nglom = −2.86e−06, P < 0.001, coefficient hypertension = 1.71, P < 0.001; whites, coefficient Nglom = −3.24e−06, P < 0.001, coefficient hypertension = 1.14, P = 0.01.

