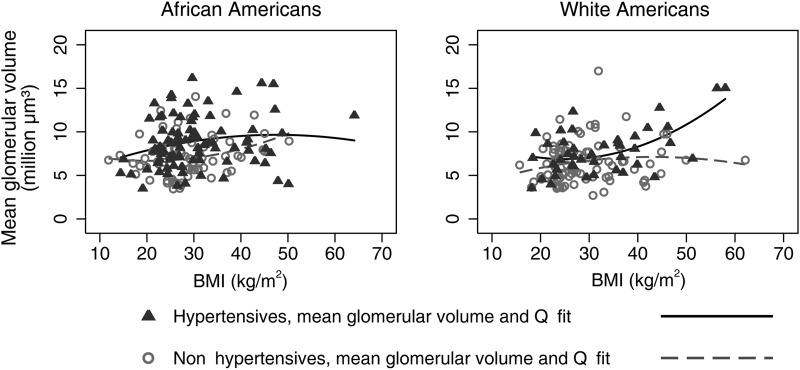
FIGURE 3:
Subjects 18–70 years old showing by quadratic prediction plots a direct relationship between Vglom and BMI for African Americans and whites in which the Vglom of hypertensive subjects are larger than that of non-hypertensive subjects throughout the range of BMI. Multivariable robust regression (Vglom-dependent variable): African Americans, coefficient BMI = 0.047, P = 0.04, coefficient hypertension = 1.78, P < 0.001; whites, coefficient BMI = 0.076, P = 0.001, coefficient hypertension = 1.55, P < 0.001.

