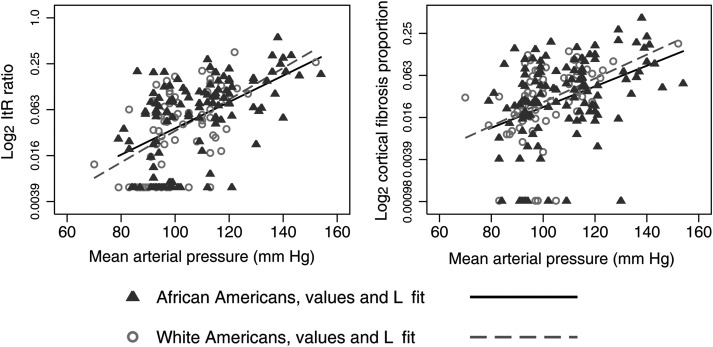
FIGURE 6:
Subjects 18–70 years old showing for African Americans and whites the linear relationships between MAP and the log 2 of arterial intimal thickening and MAP and the log 2 of the proportion of cortical fibrosis. For any level of MAP, arterial intimal thickening and the proportion of cortical fibrosis was nearly the same in the two races (interaction, P = 0.54 for arterial intimal thickening; P = 0.52 for cortical fibrosis).

