Figure 1.
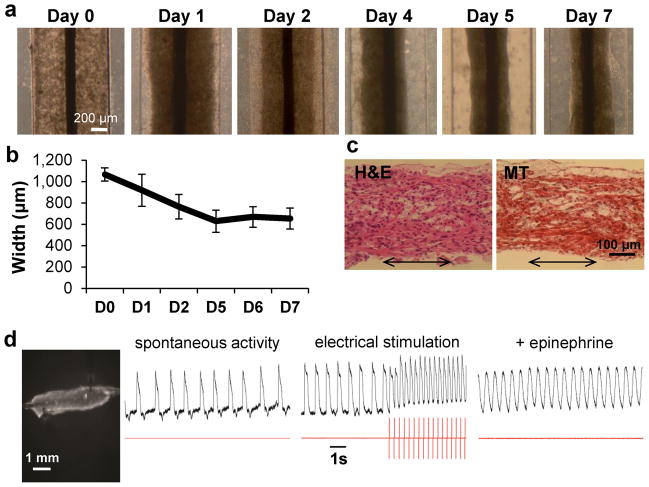
Generation of human cardiac biowires. (a) Pre-culture of hESC-cardiomyocyte in biowire template for 7 days allowed cells to remodel the gel and contract around the suture. (b) Quantification of gel contraction demonstrated compaction of ~40% (average ± s.d., n = 3–4 wires). (c) Hematoxylin and Eosin (H&E) and Masson’s Trichrome (MT) staining of biowire sections show cell alignment along the suture axis (arrows represent suture axis). (d) Optical mapping of impulse propagation. A representative picture (left) of a biowire being imaged with potentiometric fluorophore (DI-4-ANEPPS) showing the spontaneous electrical activity, with impulse propagation recording (left trace recording), response to electrical stimulation (middle trace recording, stimulation frequency is depicted in red trace below; electrical capture can be seen during stimulation along with associated change in morphology of action potential and positive baseline shift) and increase in frequency of spontaneous response under pharmacological stimulation (epinephrine, right trace recording). (e, f) Electrical stimulation regimens applied. Pre-cultured biowires were submitted to electrical stimulation at 3–4 V/cm for 1 week. (e) Electrical stimulation started at 1 Hz and was progressively increased to 3 Hz where it was kept for the remainder of the week (low frequency ramp-up stimulation regimen or 3 Hz). (f) Stimulation rate was progressively increased from 1 to 6 Hz (High frequency ramp-up stimulation regimen or 6 Hz). (g) At the end of the stimulation, biowires were assessed for functional, ultrastructural, cellular and molecular responses as depicted. (a–d) Illustrate results with Hes2 hESC-derived cardiomyocytes.

