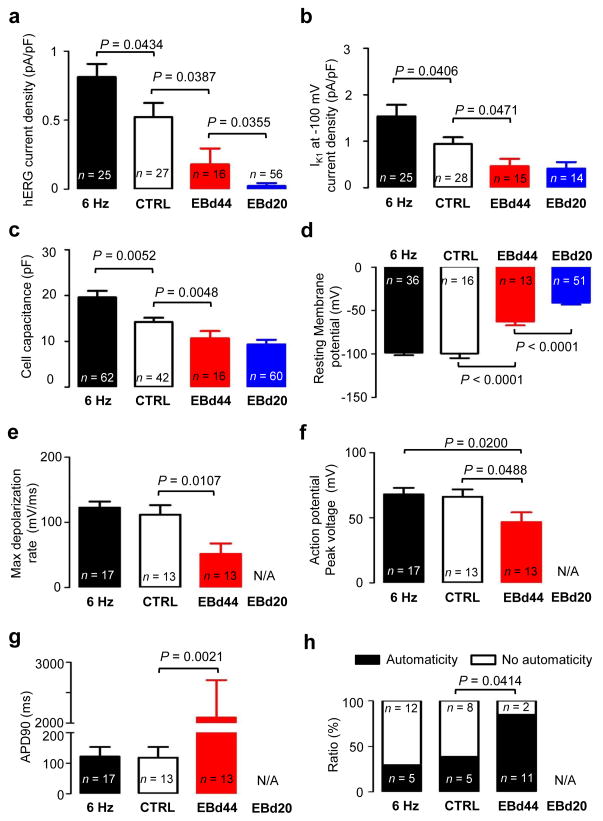
Figure 5.
Electrophysiological properties in single cell cardiomyocytes isolated from biowires or embryoid bodies and recorded with patch-clamp. Six Hz stimulated biowire (black), control biowire (white), EBd44 (red) and EBd20 (blue) are shown. (a) hERG tail current density, (b) IK1 current density measured at −100 mV, (c) cell capacitance, (d) resting membrane potential, (e) maximum depolarization rate of action potential, (f) action potential peak voltage, (g) action potential duration measured at 90% repolarization and (h) ratio of cells displaying spontaneous beating (automaticity) or no spontaneous beating (no automaticity). (a–h) Illustrate results with hESC-derived cardiomyocytes obtained from Hes2 cell line. Average ± s.e.m.

