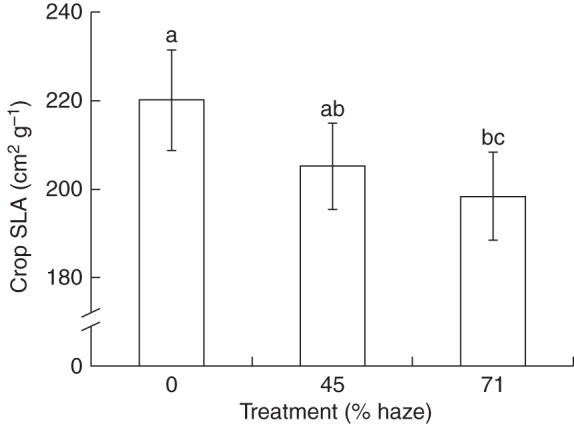
Fig. 2.

The effect of haze treatments on crop specific leaf area (SLA). Leaf samples were averaged down the canopy and over two sunny (7 April and 4 July) and two cloudy days (8 June and 1 September). On each date four replicate plants were sampled per treatment. Error bars show ±s.e. (n = 16). Letters show statistically significant differences (P < 0·05).
