
Fig. 3.
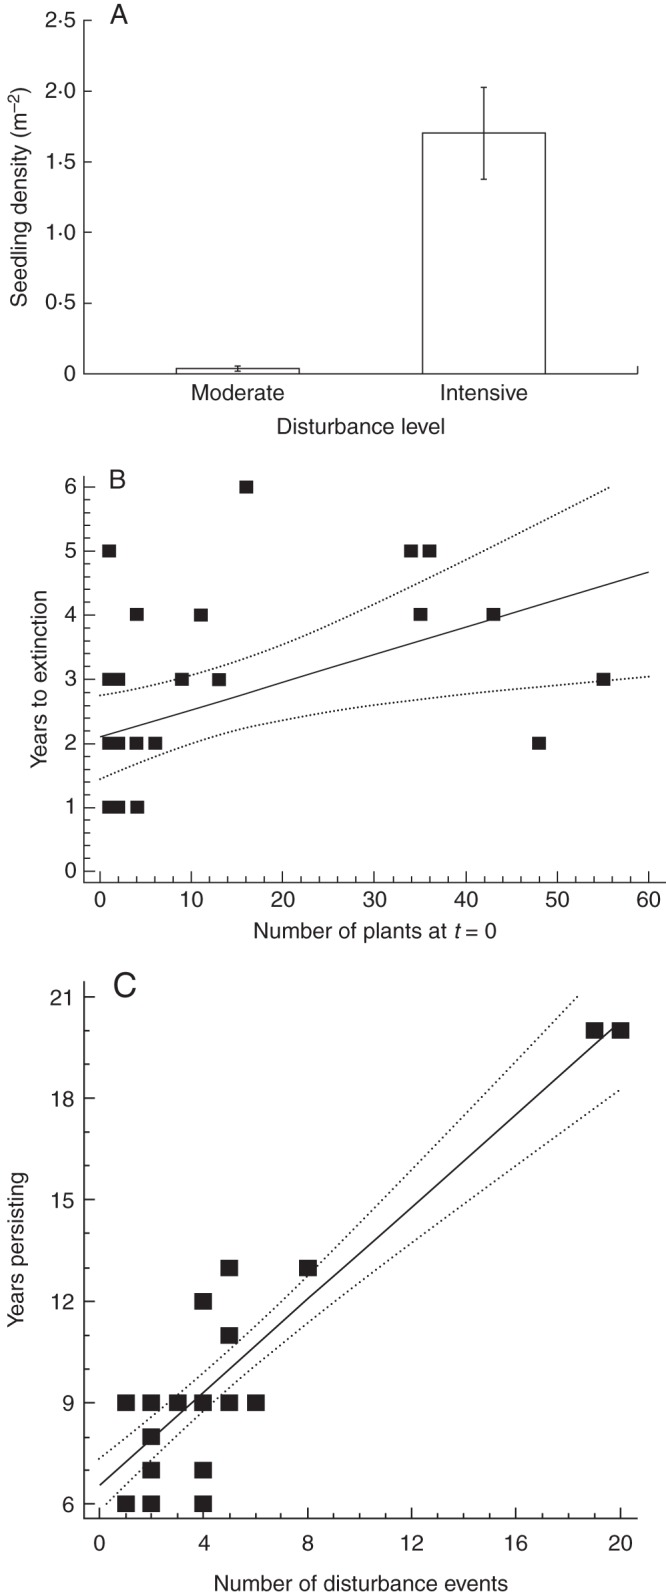
(A) Relationship between disturbance levels (moderate and intense) and the density of seedlings per m2 ± s.e. Moderate disturbance is recent evidence (<6 months old) of disturbance (e.g. disturbed leaf litter, plants slashed by road equipment); intensive disturbance is bare earth exposed recently (<6 months old, e.g. by roadside grading, lyrebird scratchings). The differences were significant (F1,18 = 146·18, P < 0·0001). A third class of disturbance, undisturbed (see the Methods section for details) was only associated with seedlings once, with five seedlings over 25 m2. (B) Relationship between the number of plants that establish at time = 0 and the longevity of the population (years to extinction) (R2 = 0·22, P = 0·01). (C) Relationship between disturbance and population persistence (number of disturbance events) (R2 = 0·83, P<0·0001).