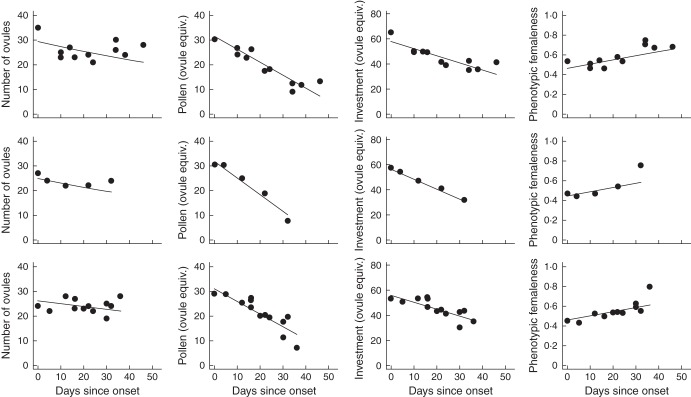
Fig. 3.
Within-plant effects of time on ovules per flower bud, adjusted pollen per flower bud (ovule equivalents), total gametes per flower bud (ovule equivalents) and flower femaleness. Plots are shown for three randomly chosen Brassica rapa plants (top row: plant 181; middle row: plant 241; bottom row: plant 659). All response variables are plotted against day of flower collection, measured as days since flowering onset as estimated by the first day of bud collection. Trends estimated with hierarchical regression.

