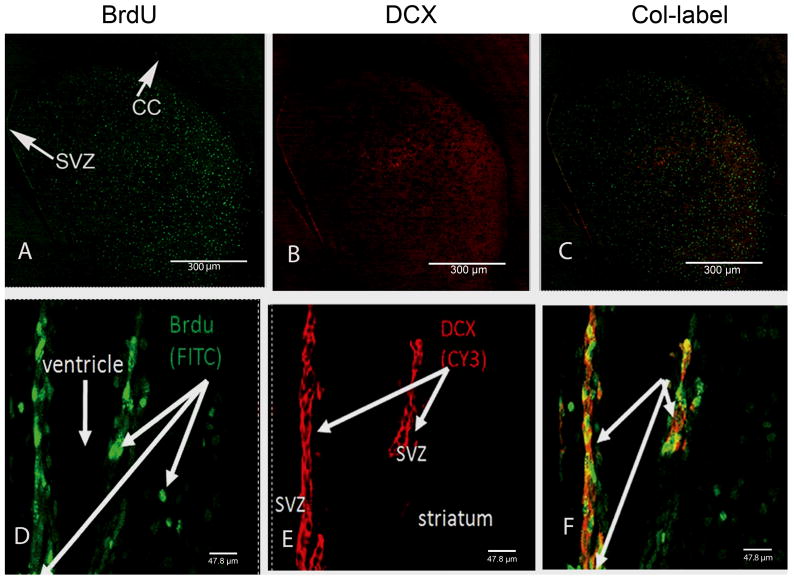
Figure 3.
BrdU-positive nuclei co-labeled with DCX. Confocal z-stack images were taken from representative striatal tissue sections at 2.5 days after METH. BrdU-positive nuclei are labeled in green with FITC (A, D) and DCX-positive progenitors are labeled with Cy3 in red (B, E). No co-labeled cells can be seen in the same striatal tissue section but are present in the SVZ (C, F). Top panel scale bar 300 μm taken at 5x magnification. Magnified SVZ image (D–F) scale bar 47.3 μm taken at 63x magnification (n=4). CC, corpus callosum; SVZ, subventricular zone.

