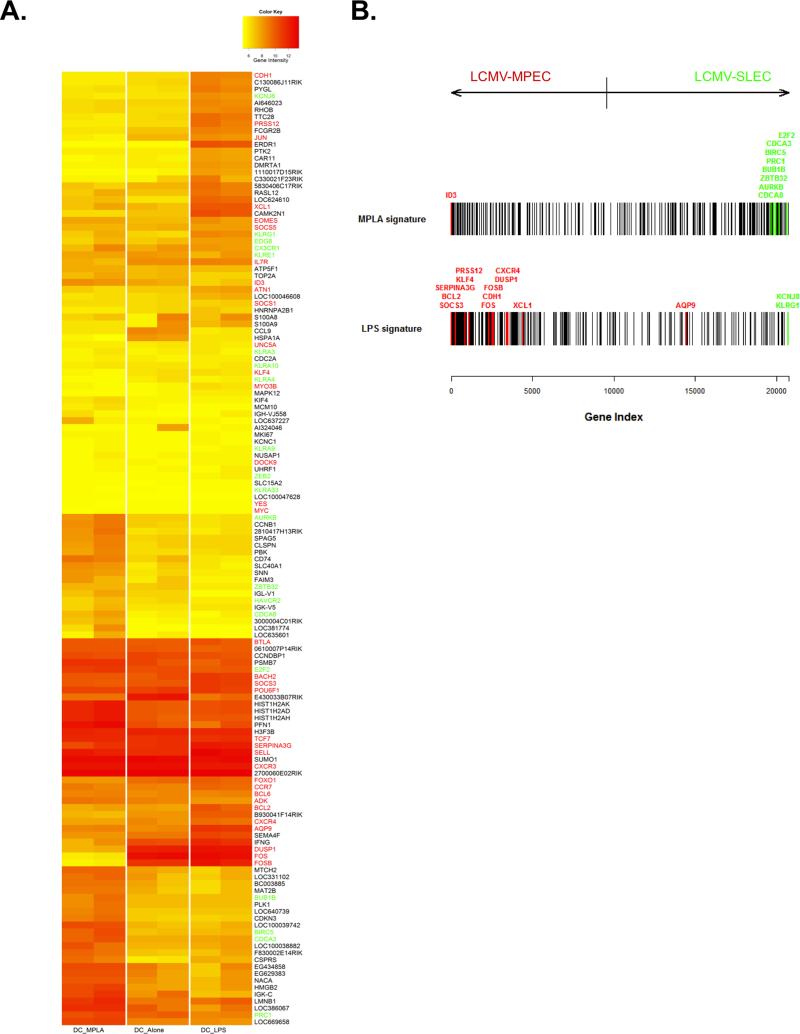
Figure 5. LPS promoted memory signature genes expression and memory T cell maturation.
B6 mice containing a small number of naive P14 CD8+ T cells were immunized with either DC-33 alone or in combination with LPS or MPLA. KLRG1loIL-7Rhi MPECs were purified by FACS sort and their mRNA was isolated and subjected to whole-genome expression profiling using Illumina MouseWG-6 v2.0 Expression BeadChips. (A) Heat map shows gene expression of 96 probe sets with highest variance (Coefficient of Variation > 0.8) and 54 known memory (in red) and effector (in green) signature genes across the CD8+ T cell populations primed via DC-33 alone, DC-33+LPS and DC-33+MPLA. Colors indicate log2 expression intensities. (B) Barcode plot shows the locations of signature genes of LPS- and MPLA- primed CD8+ T cells in the full ordered gene list ranked by the t-statistics to quantify the differential expression in LCMV-MPECs versus LCMV-SLECs. MPLA-signature genes (vertical bars in top barcode) are enriched among genes up-regulated in SLECs (towards the right) (P = 8.2e-06) whereas LPS-signature genes are enriched among genes up-regulated in the MPEC samples (towards the left) (P = 3.4e-13). Known memory signature genes are in red and effector signature genes are in green.

