
Figure 1.
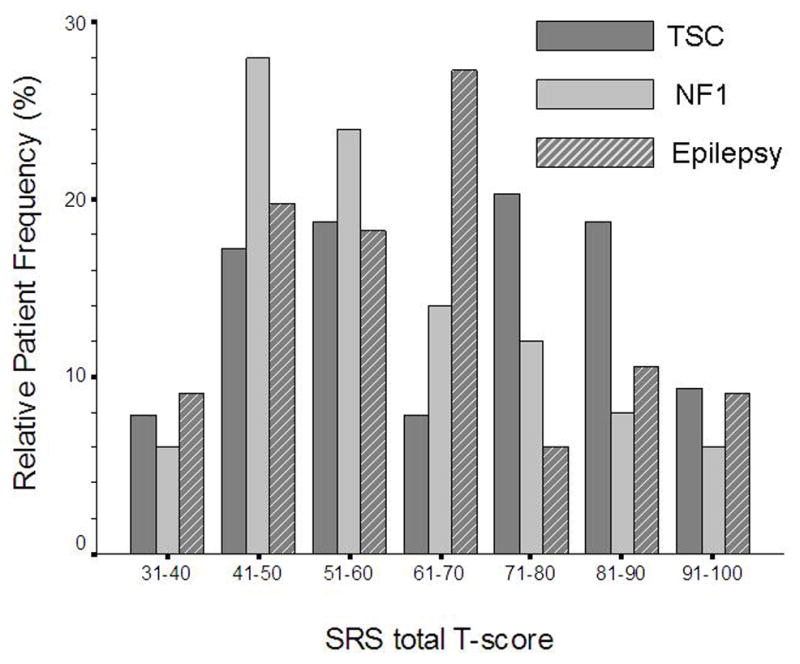
Histogram showing distribution of Social Responsiveness Scale (SRS) scores for the relative frequencies of patients with tuberous sclerosis complex (TSC, n=64), neurofibromatosis type 1 (n=50), and epilepsy (n=66). Note the bimodal distribution pattern in the TSC cohort. An SRS total score >75 indicates a high suspicion of autism, while a score between 60 and 75 is indicative of another autism spectrum disorder such as pervasive developmental disorder not otherwise specified.