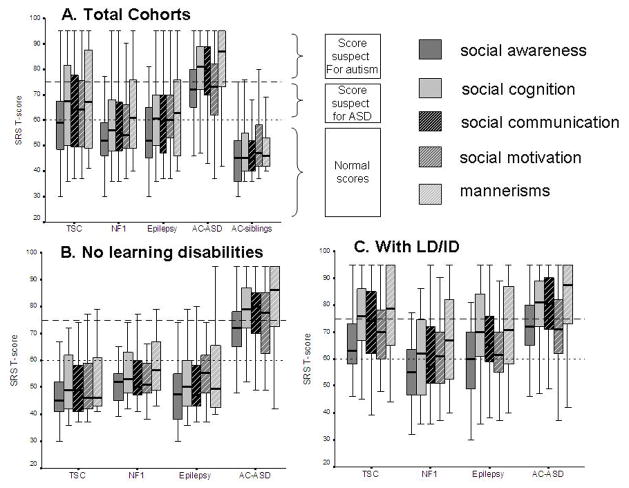
Figure 3.
Boxplots depicting Social Responsiveness Scale (SRS) trait profiles for selected study cohorts. Each box shows the median and quartiles within a category. Reference lines indicate thresholds above which T-scores are clinically suspect for autism (>75, striped line) or other autism spectrum disorders (ASDs) (60–75, dotted line). (a) SRS scores for all cohorts, including patients with tuberous sclerosis complex (TSC, n=64), neurofibromatosis type 1 (NF1, n=50), epilepsy (n=66), idiopathic ASD (n=210), and sibling comparison group (n=130). (b) SRS trait scores for individuals without intellectual disability or learning disability, with TSC (n=22), NF1 (n=22), epilepsy (n=32), and idiopathic ASD (n=67). (c) SRS trait scores for individuals with a specific learning disability or intellectual disability (LD/ID) with TSC (n=42), NF1 (n=27), epilepsy (n=34), and idiopathic ASD (n=142).
[Typesetter: change ABC labels to lower case: move title of each graph to bottom of graph]

