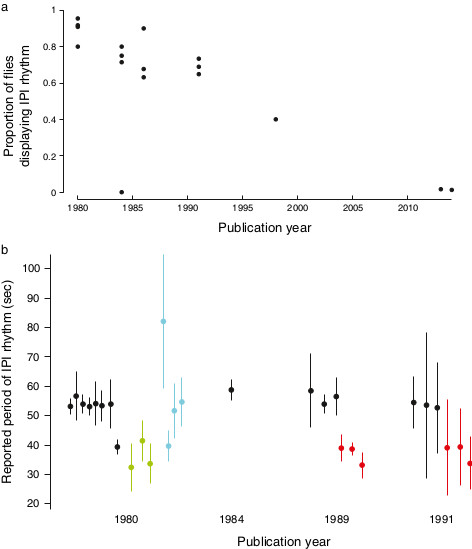
Figure 2.

History of reported values for KH cycles in Drosophila species and mutants. (a) The proportion of animals that were reported to display ‘significant’ KH cycling has declined on average over consecutive publications. Note that different methods were employed to detect rhythms in different studies and statistical significance was assessed in different ways in different studies. The data from 2013 is from a publication that includes the current author and the data from 2014 are from this publication. (b) Estimates of the distribution of the period of KH cycles from publications from four years. Dots represent the mean and bars represent twice the standard deviation, back calculated from the reported standard errors of the mean and sample sizes. The bars thus include approximately 95% of the estimated song rhythms for each sample. Different colors represent songs from animals with different genotypes: Black are D. melanogaster wild type, red are D. simulans wild type, green are periodshort, blue are periodlong. IPI, inter-pulse interval.
