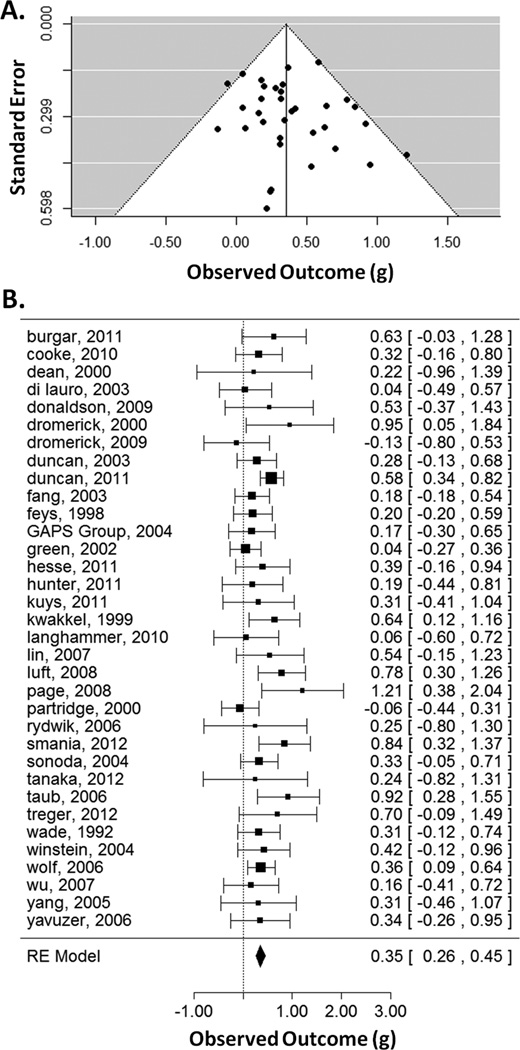
Figure 1.
Funnel plot (A) showing effect-sizes (g) as a function of precision (standard error). Asymmetry was not significant. Forest plot (B) showing the effect-sizes and 95% confidence intervals for each study and the summary effect-size from the random-effects model. Positive values show a difference in favor of increased time scheduled for therapy. RE=random effects.

