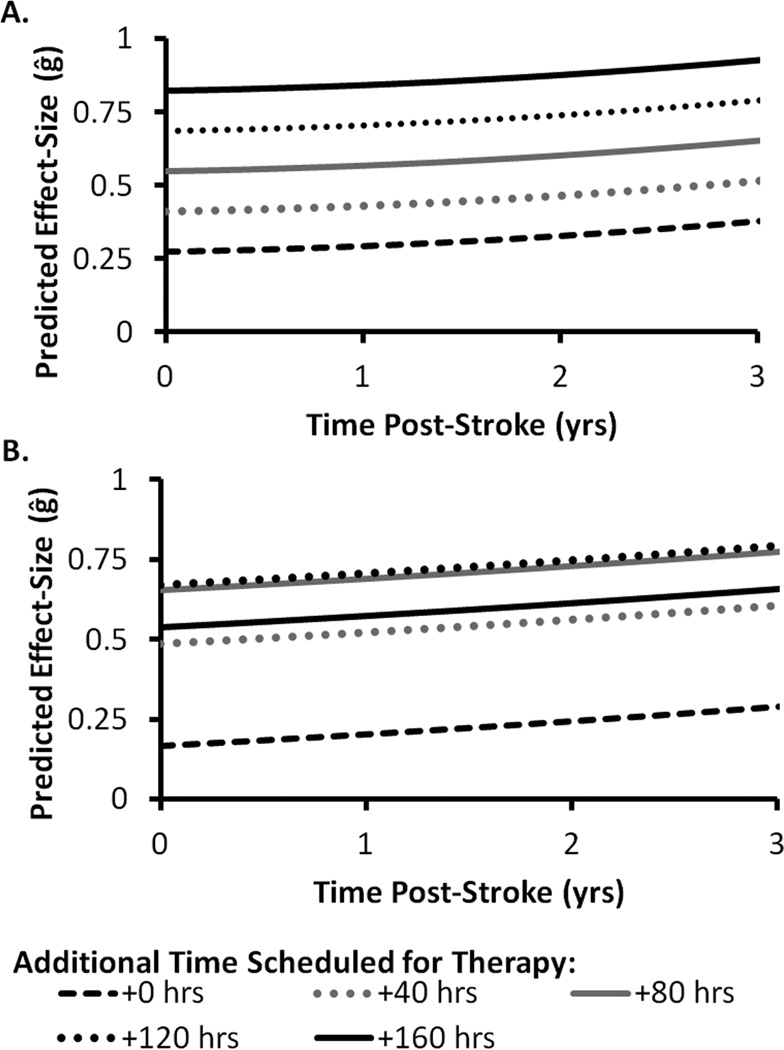
Figure 3.
Predicted effect-size (ĝ) as a function years post-stroke (x-axis) and select values of additional time scheduled for therapy (separate lines). Model 3 (A) includes the linear effect of time scheduled for therapy. Model 4 (B) includes the linear and quadratic effects of time scheduled for therapy. The dashed black line (+0 hrs) represents the predicted effect-size when no additional time is scheduled for therapy between treatment and control groups.

