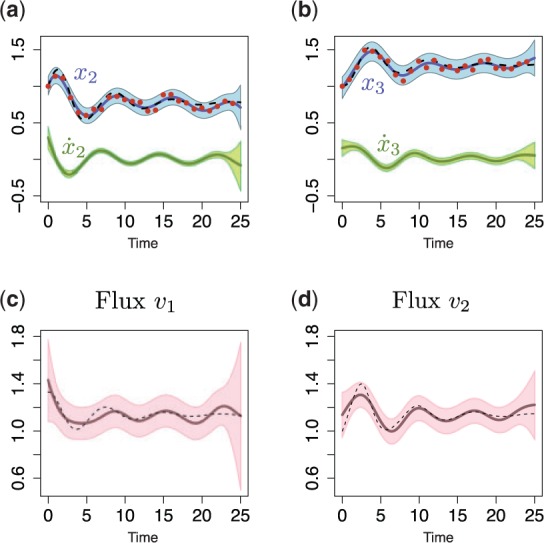
Fig. 2.

Predictions with MGPs model for linear metabolic pathway. (a and b) Dashed lines represent a simulated x2 and x3 trajectories from ODE model; dots correspond to the sparse noisy observations for x2 and x3 (data); solid blue/green lines are the mean behaviour of the MGPs model (blue, predictions with original GPs; green, predictions with derivative process); light areas correspond to two standard deviations at each prediction point. (c and d) Dark lines are predicted fluxes, light areas correspond to the confidence region, and dashed lines represent true behaviour of noise-free fluxes v1 and v2 (calculated from ODE system)
