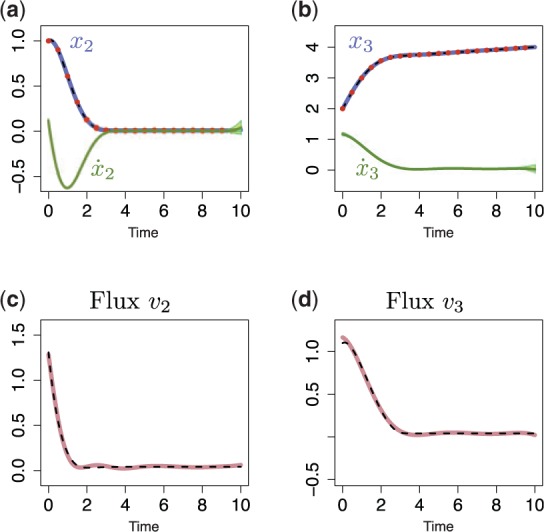
Fig. 4.

Predictions with MGP model for a branched metabolic pathway. (a and b) Dashed lines represent simulated x2 and x3 trajectories from the ODE model; red dots correspond to the sparse observations for x2 and x3 (data); solid lines are the mean behaviour of the MGPs model (blue, predictions with original GPs; green, predictions with derivative process); light areas correspond to two standard deviations at each prediction point. (c and d) Dark lines are predicted fluxes; dashed lines represent true behaviour of fluxes v2 and v3 (calculated from the ODE system)
