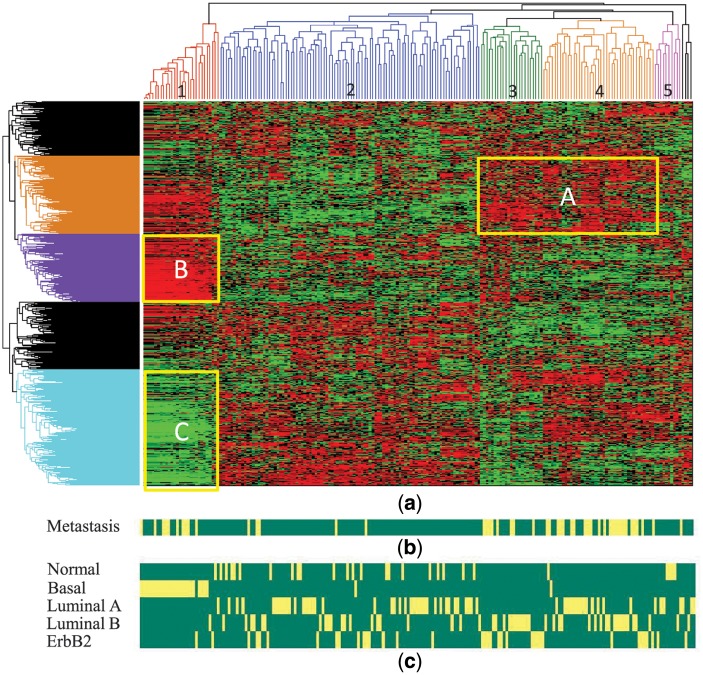
Fig. 5.
Hierarchical clustering of PC-classifier models from NKI dataset. (a) Dendrogram and heatmap of the base classifiers, where each column corresponds to a patient and each row to a gene. Each pixel in the heatmap corresponds to SVM coefficient value of the gene in the base classifier model for a particular representing patient. Low values are in green, and high values are in red. (b) Metastasis status of the corresponding patients. (c) Cancer subtype for each patient defined by van de Vijver et al. (2002)

