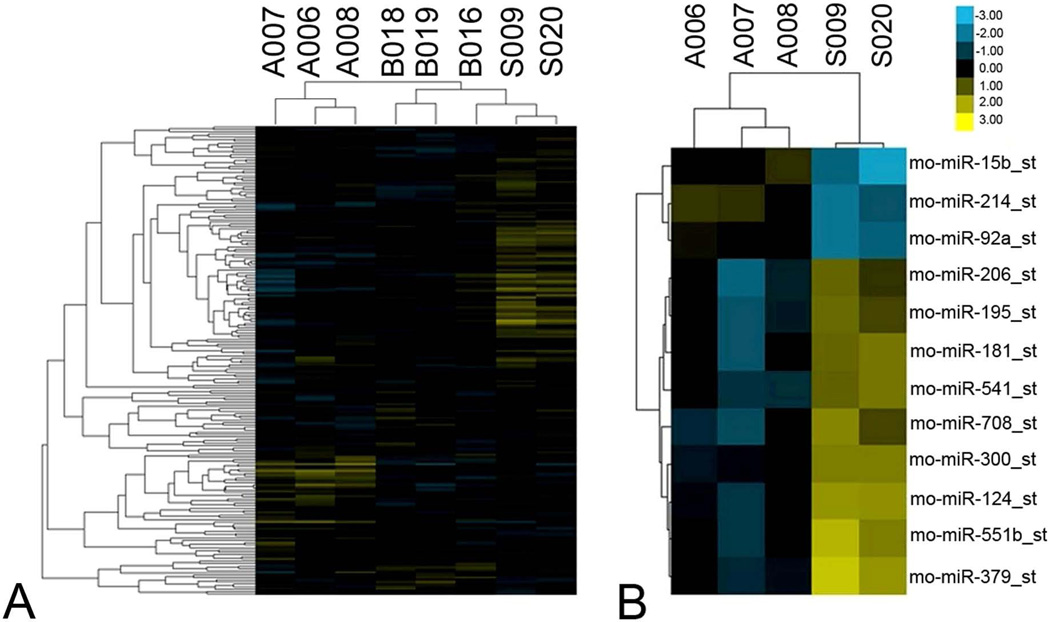
Figure 1. microRNA profiles differentiate ischemic rats from sham-operated rats.
(A) Comparative microRNA expression of sham-operated and MCAO rats at 24h and 72h following transient focal cerebral ischemia (n=3/group). (B) Differentially expressed microRNAs between ischemic and sham-operated rats at 72 h after MCAO (n=3/group). Each column of the heatmap figure represents a particular microarray sample (24h after reperfusion: B016, B018, B019; 72h after reperfusion: A006, A007, A008; sham: S009, S020). And each row is a microRNA (miR-15b, -214, -92a, -206, -195, -181, -541, -708, -300, -124, -551b, -379). Heatmap coloring is based on microRNA expression levels. Blue is down-regulated and yellow is up-regulated.

