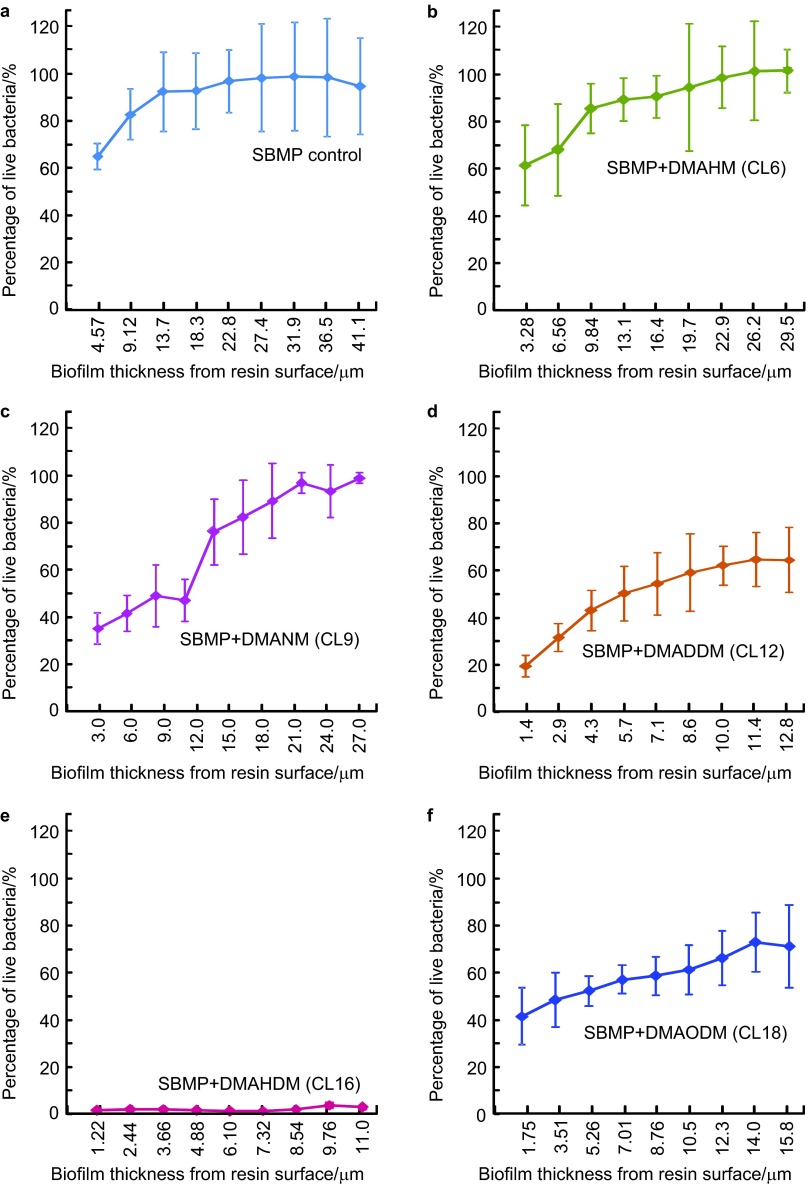
Figure 6.
Viability distribution in biofilm (mean±s.d.; n=6). The percentage of live bacteria was measured from 2D images (Figure 5). Percentage of live bacteria=live bacteria area/(live bacteria area+dead bacteria area). Percentage of live bacteria is plotted vs. location of 2D image in biofilm at distance from resin surface. (a) SBMP control; (b) SBMP+DMAHM (CL6); (c) SBMP+DMANM (CL9); (d) SBMP+DMADDM (CL12); (e) SBMP+DMAHDM (CL16); (f) SBMP+DMAODM (CL18). The curve for SBMP+DMAPM (CL3) is similar to SBMP control and is not included. CL, chain length; 2D, two-dimensional; DMADDM, dimethylaminododecyl methacrylate; DMAHDM, dimethylaminohexadecyl methacrylate; DMAHM, dimethylaminohexyl methacrylate; DMANM, dimethylaminononyl methacrylate; DMAODM, dimethylaminooctadecyl methacrylate; DMAPM, dimethylaminopropyl methacrylate; SBMP, Scotchbond multi-purpose bonding agent; s.d., standard deviation.

