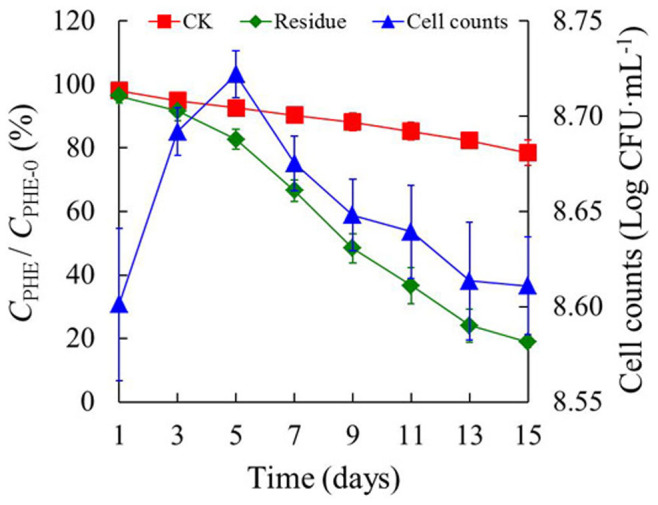
Figure 4. The degradation kinetics of phenanthrene and growth curves of strain Ph6-gfp in culture solution.

CPHE represents the residual concentration of phenanthrene in solution at a given time. CPHE-0 represents the initial concentration of phenanthrene in solution. After the inoculation of strain Ph6-gfp-free (Red line) and strain Ph6-gfp (Green line) in a high PAH-contaminated culture solution (50 mg·L−1 Phenanthrene) for 15 days, the residual rate of phenanthrene was detected by high-performance liquid chromatography (HPLC), and the growth of strain Ph6-gfp (Blue line) was detected by counting the CFU on plates. Error bars are standard deviations (n = 3); in some case, these are not visible as they are smaller than the graph points.
