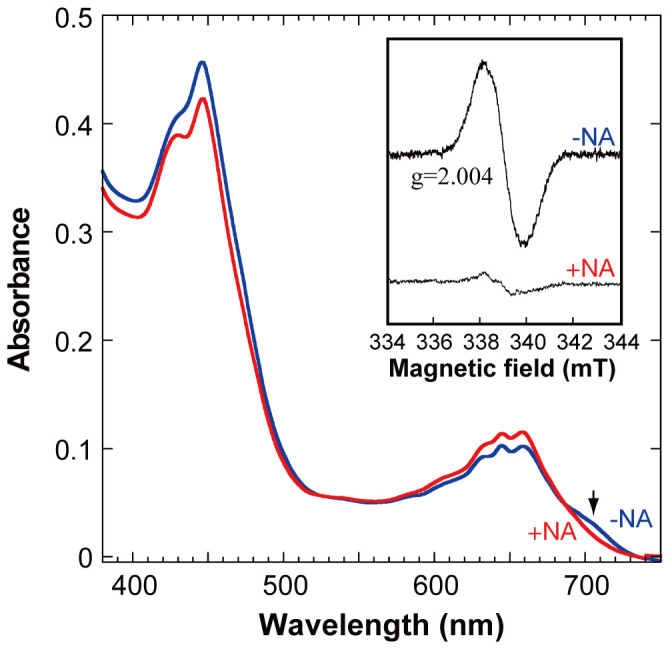
Figure 4. Absorption spectra of the combination of D274A and Pchlide in the presence (red) and absence (blue) of NA.

An arrow indicates the decreased peak at 705 nm upon the NA addition. Inset: EPR spectra of the combination of D274A and Pchlide in the presence (lower trace) and absence (upper trace) of NA.
