Figure 2.

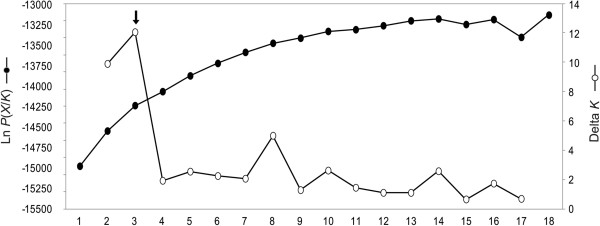
Log-likelihood probability (Ln P(X/K)) and the Delta K values of data. Three is indicated to be the most likely number of hypothetical genetic cluster (K) using admixture model.

Log-likelihood probability (Ln P(X/K)) and the Delta K values of data. Three is indicated to be the most likely number of hypothetical genetic cluster (K) using admixture model.